> ## Documentation Index
> Fetch the complete documentation index at: https://knowledge.komo.tech/llms.txt
> Use this file to discover all available pages before exploring further.
# Insights and Dashboards
> Create custom insights and dashboards to stay up to date with the most important metrics across your workspace and hubs.
## What is it?
Our Custom Insights and Dashboards feature is designed to give you complete control over how you visualize and interpret your activation data. With this tool, you can create tailored insights and dashboards that highlight the key metrics most relevant to your specific goals, allowing you to stay up to date with critical performance indicators across your entire workspace and Engagement Hubs.
## How do I set it up?
### Step 1: Create an Insight
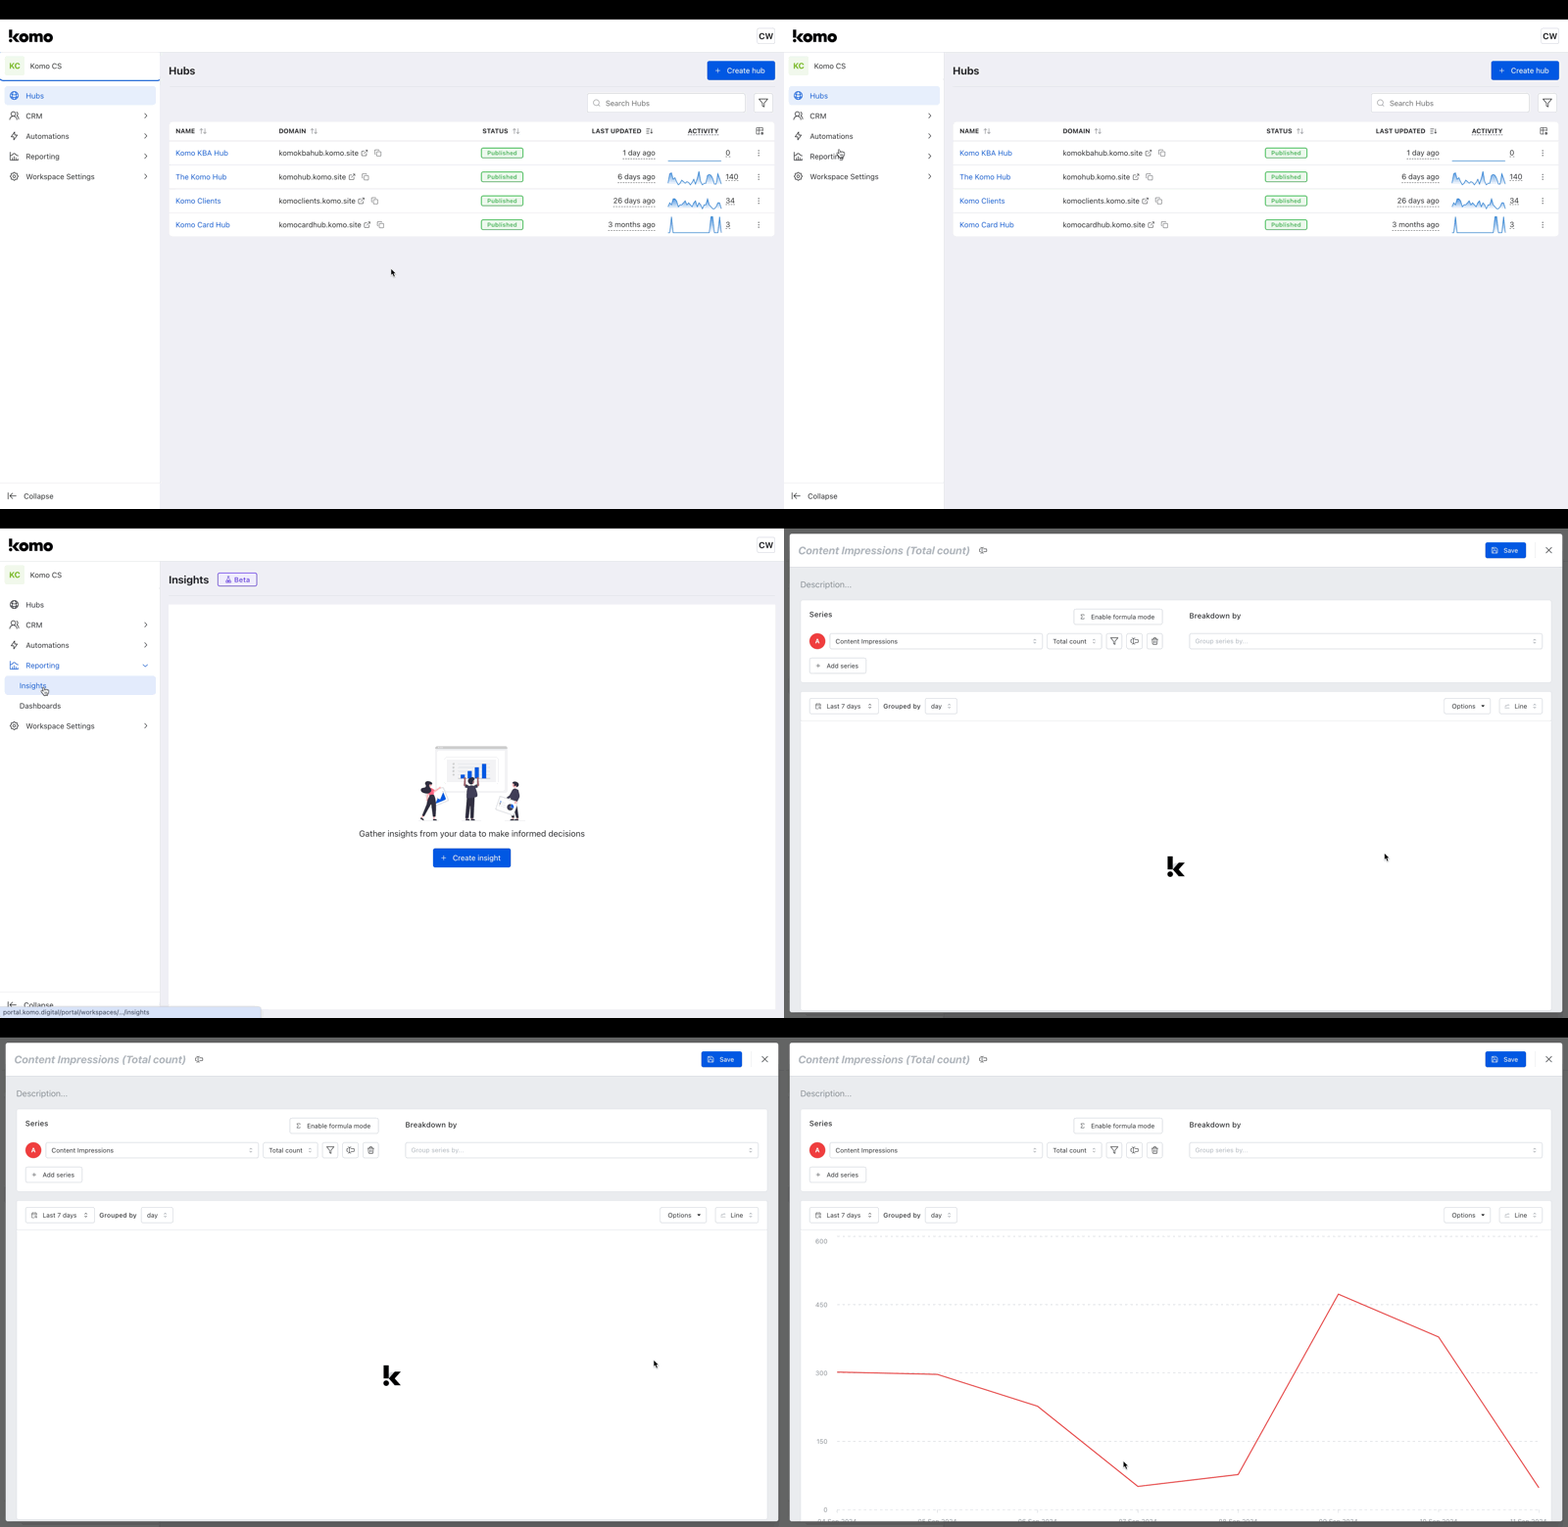 * From within your workspace, navigate to **Insights** (located under Reporting in the left-hand column)
* Once there, click **+ Create insight**
* You will then see that your new insight has been created
### Step 2: Edit Insight parameters
* From within your workspace, navigate to **Insights** (located under Reporting in the left-hand column)
* Once there, click **+ Create insight**
* You will then see that your new insight has been created
### Step 2: Edit Insight parameters
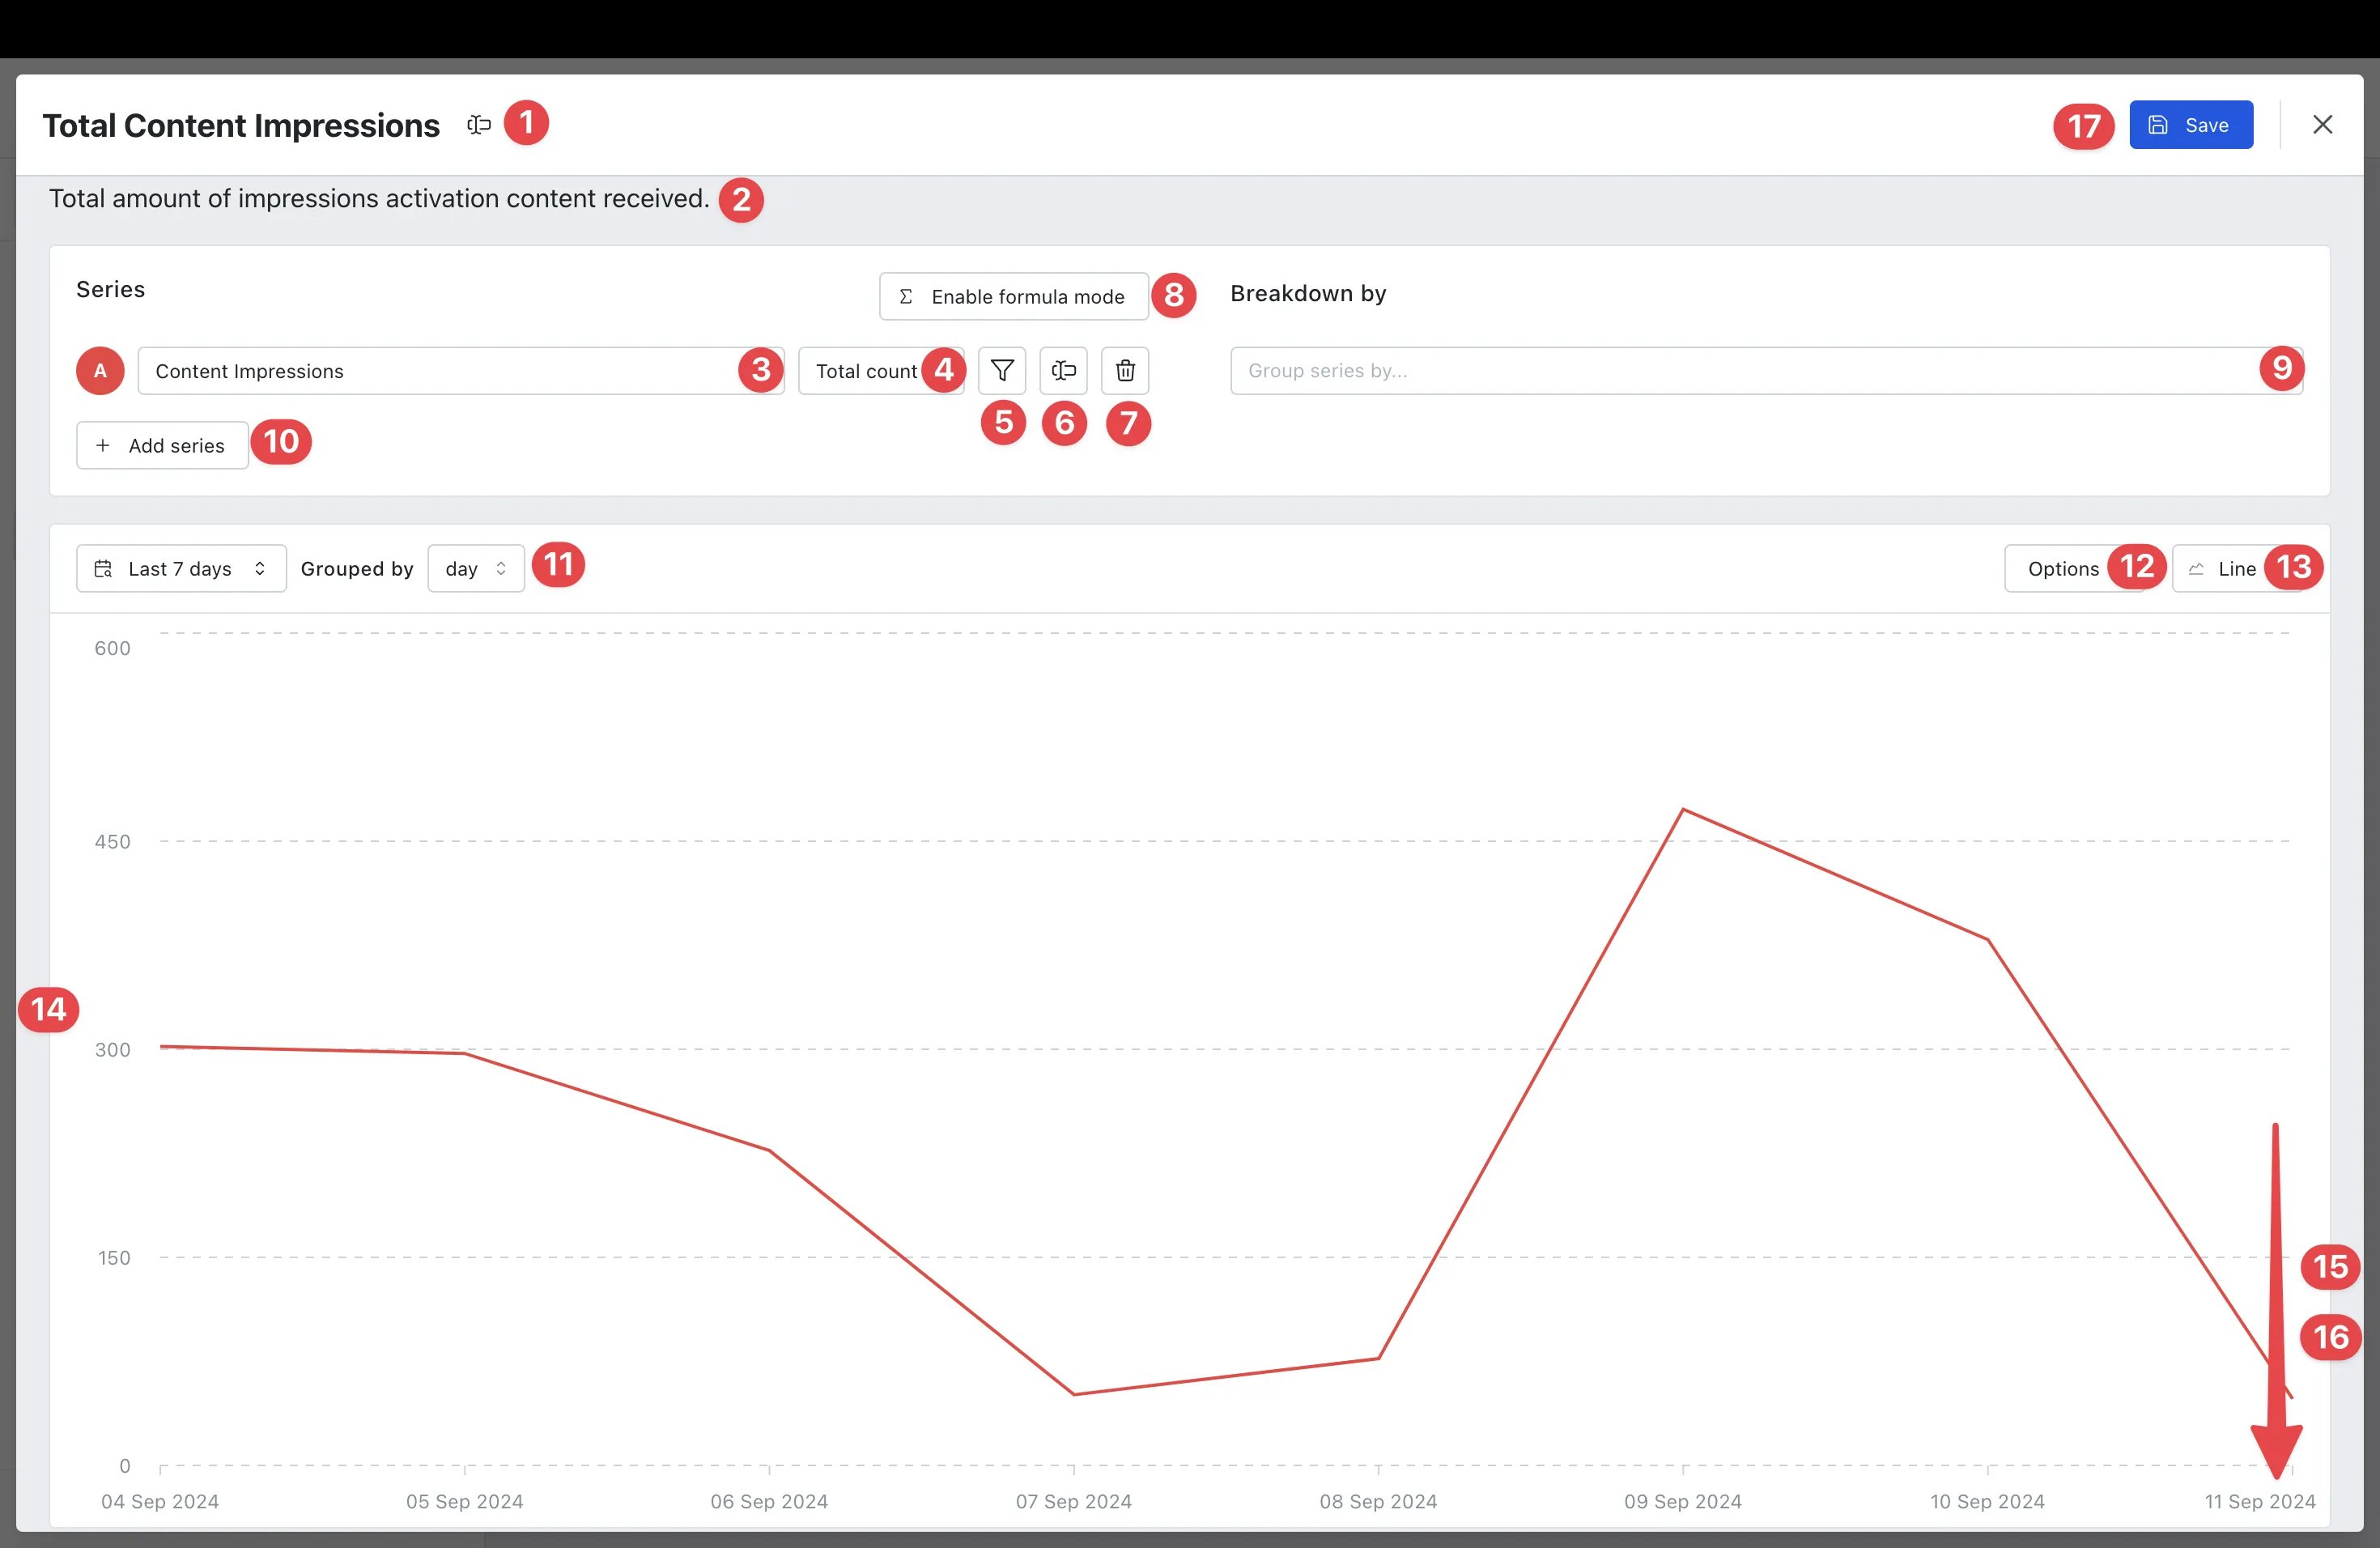 * **(1)** Give your Insight a relevant **Name**
* **(2)** Provide a **description** that makes clear what your insight is showing
* **(3)** Click the dropdown and select the insight **Series** you wish to be displayed
* **(1)** Give your Insight a relevant **Name**
* **(2)** Provide a **description** that makes clear what your insight is showing
* **(3)** Click the dropdown and select the insight **Series** you wish to be displayed
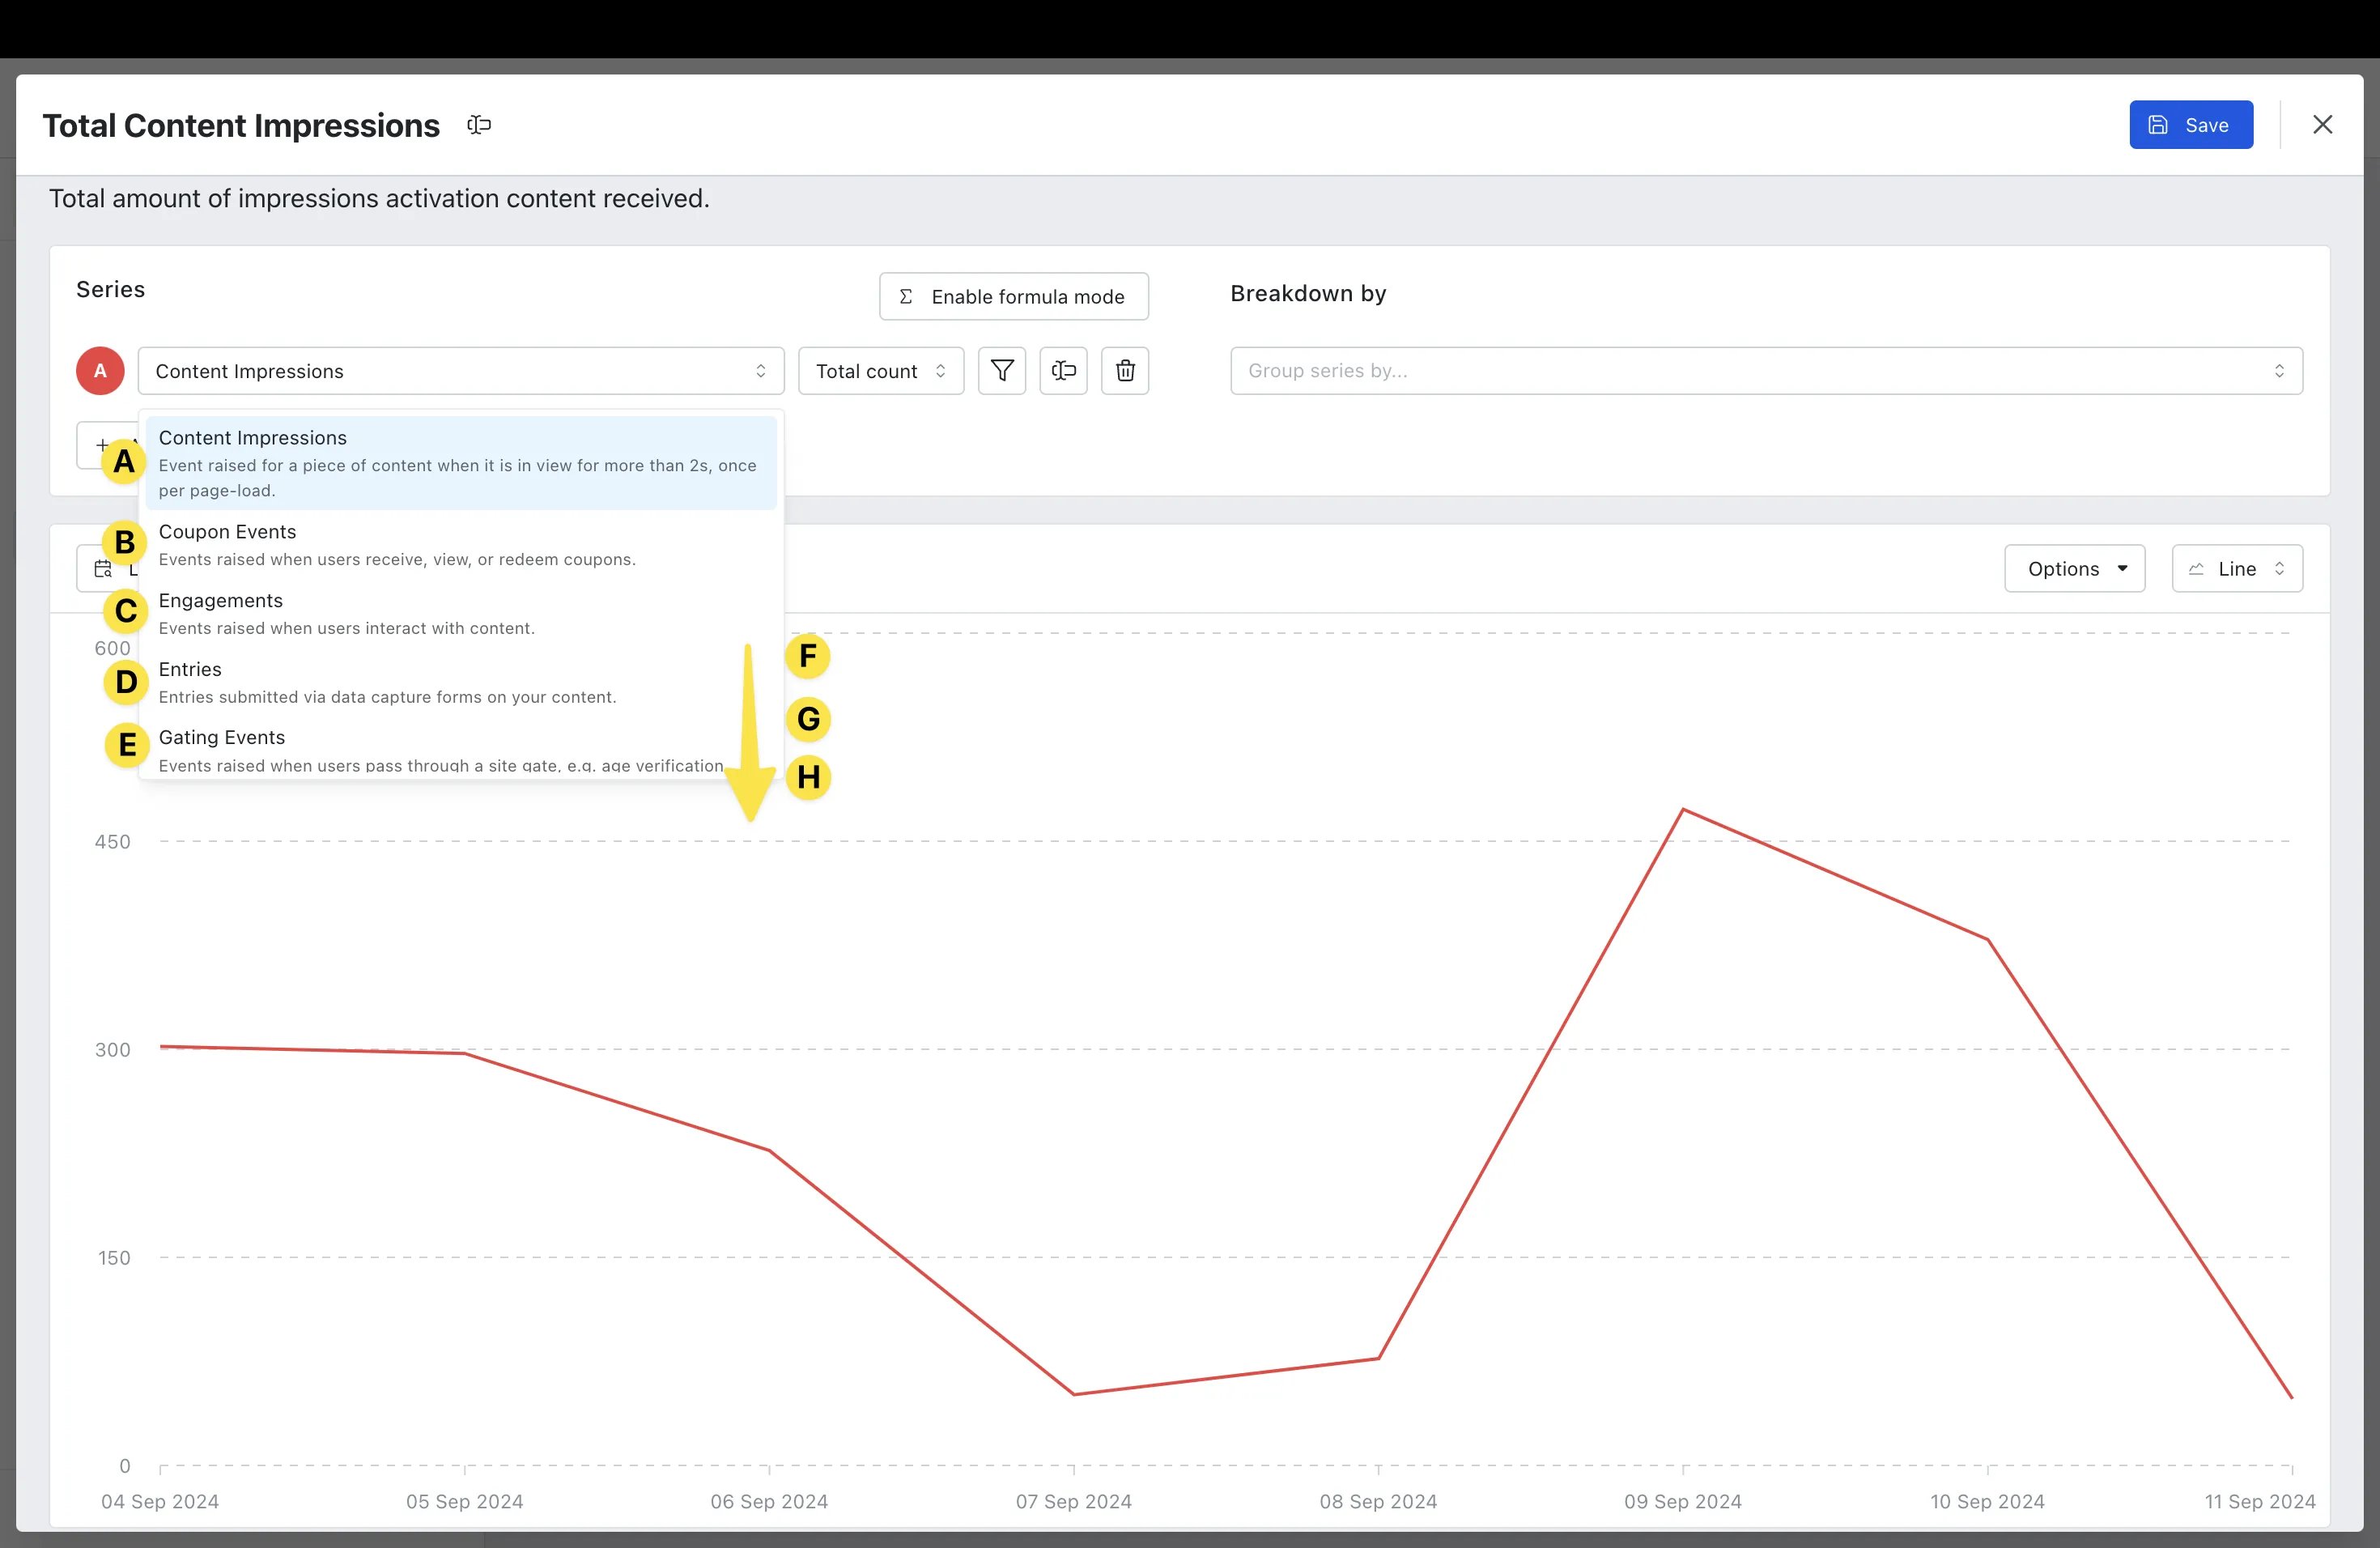 * **(A) Content Impressions** are events raised for a piece of content when it is in view for more than 2s, once per page load
* **(B) Coupon Events** are events raised when users receive, view, or redeem coupons
* **(C) Engagements** are events raised when users interact with content
* **(D) Entries** are the number of entries submitted via data capture forms on your content
* **(E) Gating Events** are events raised when users pass through a site gate e.g. age verification
* **(F) Page Views** are events raised when users view a page of content. Includes Engagement Hub pages, embedded content pages, and single card pages
* **(G) Share Events** are events raised when users share content
* **(H) Sessions** are a series of user session events that occur on a single device and browser. Sessions are ended after 30 minutes of inactivity
* **(4)** Click the dropdown and select the **aggregation** you wish to be applied to your insight
* **(A) Content Impressions** are events raised for a piece of content when it is in view for more than 2s, once per page load
* **(B) Coupon Events** are events raised when users receive, view, or redeem coupons
* **(C) Engagements** are events raised when users interact with content
* **(D) Entries** are the number of entries submitted via data capture forms on your content
* **(E) Gating Events** are events raised when users pass through a site gate e.g. age verification
* **(F) Page Views** are events raised when users view a page of content. Includes Engagement Hub pages, embedded content pages, and single card pages
* **(G) Share Events** are events raised when users share content
* **(H) Sessions** are a series of user session events that occur on a single device and browser. Sessions are ended after 30 minutes of inactivity
* **(4)** Click the dropdown and select the **aggregation** you wish to be applied to your insight
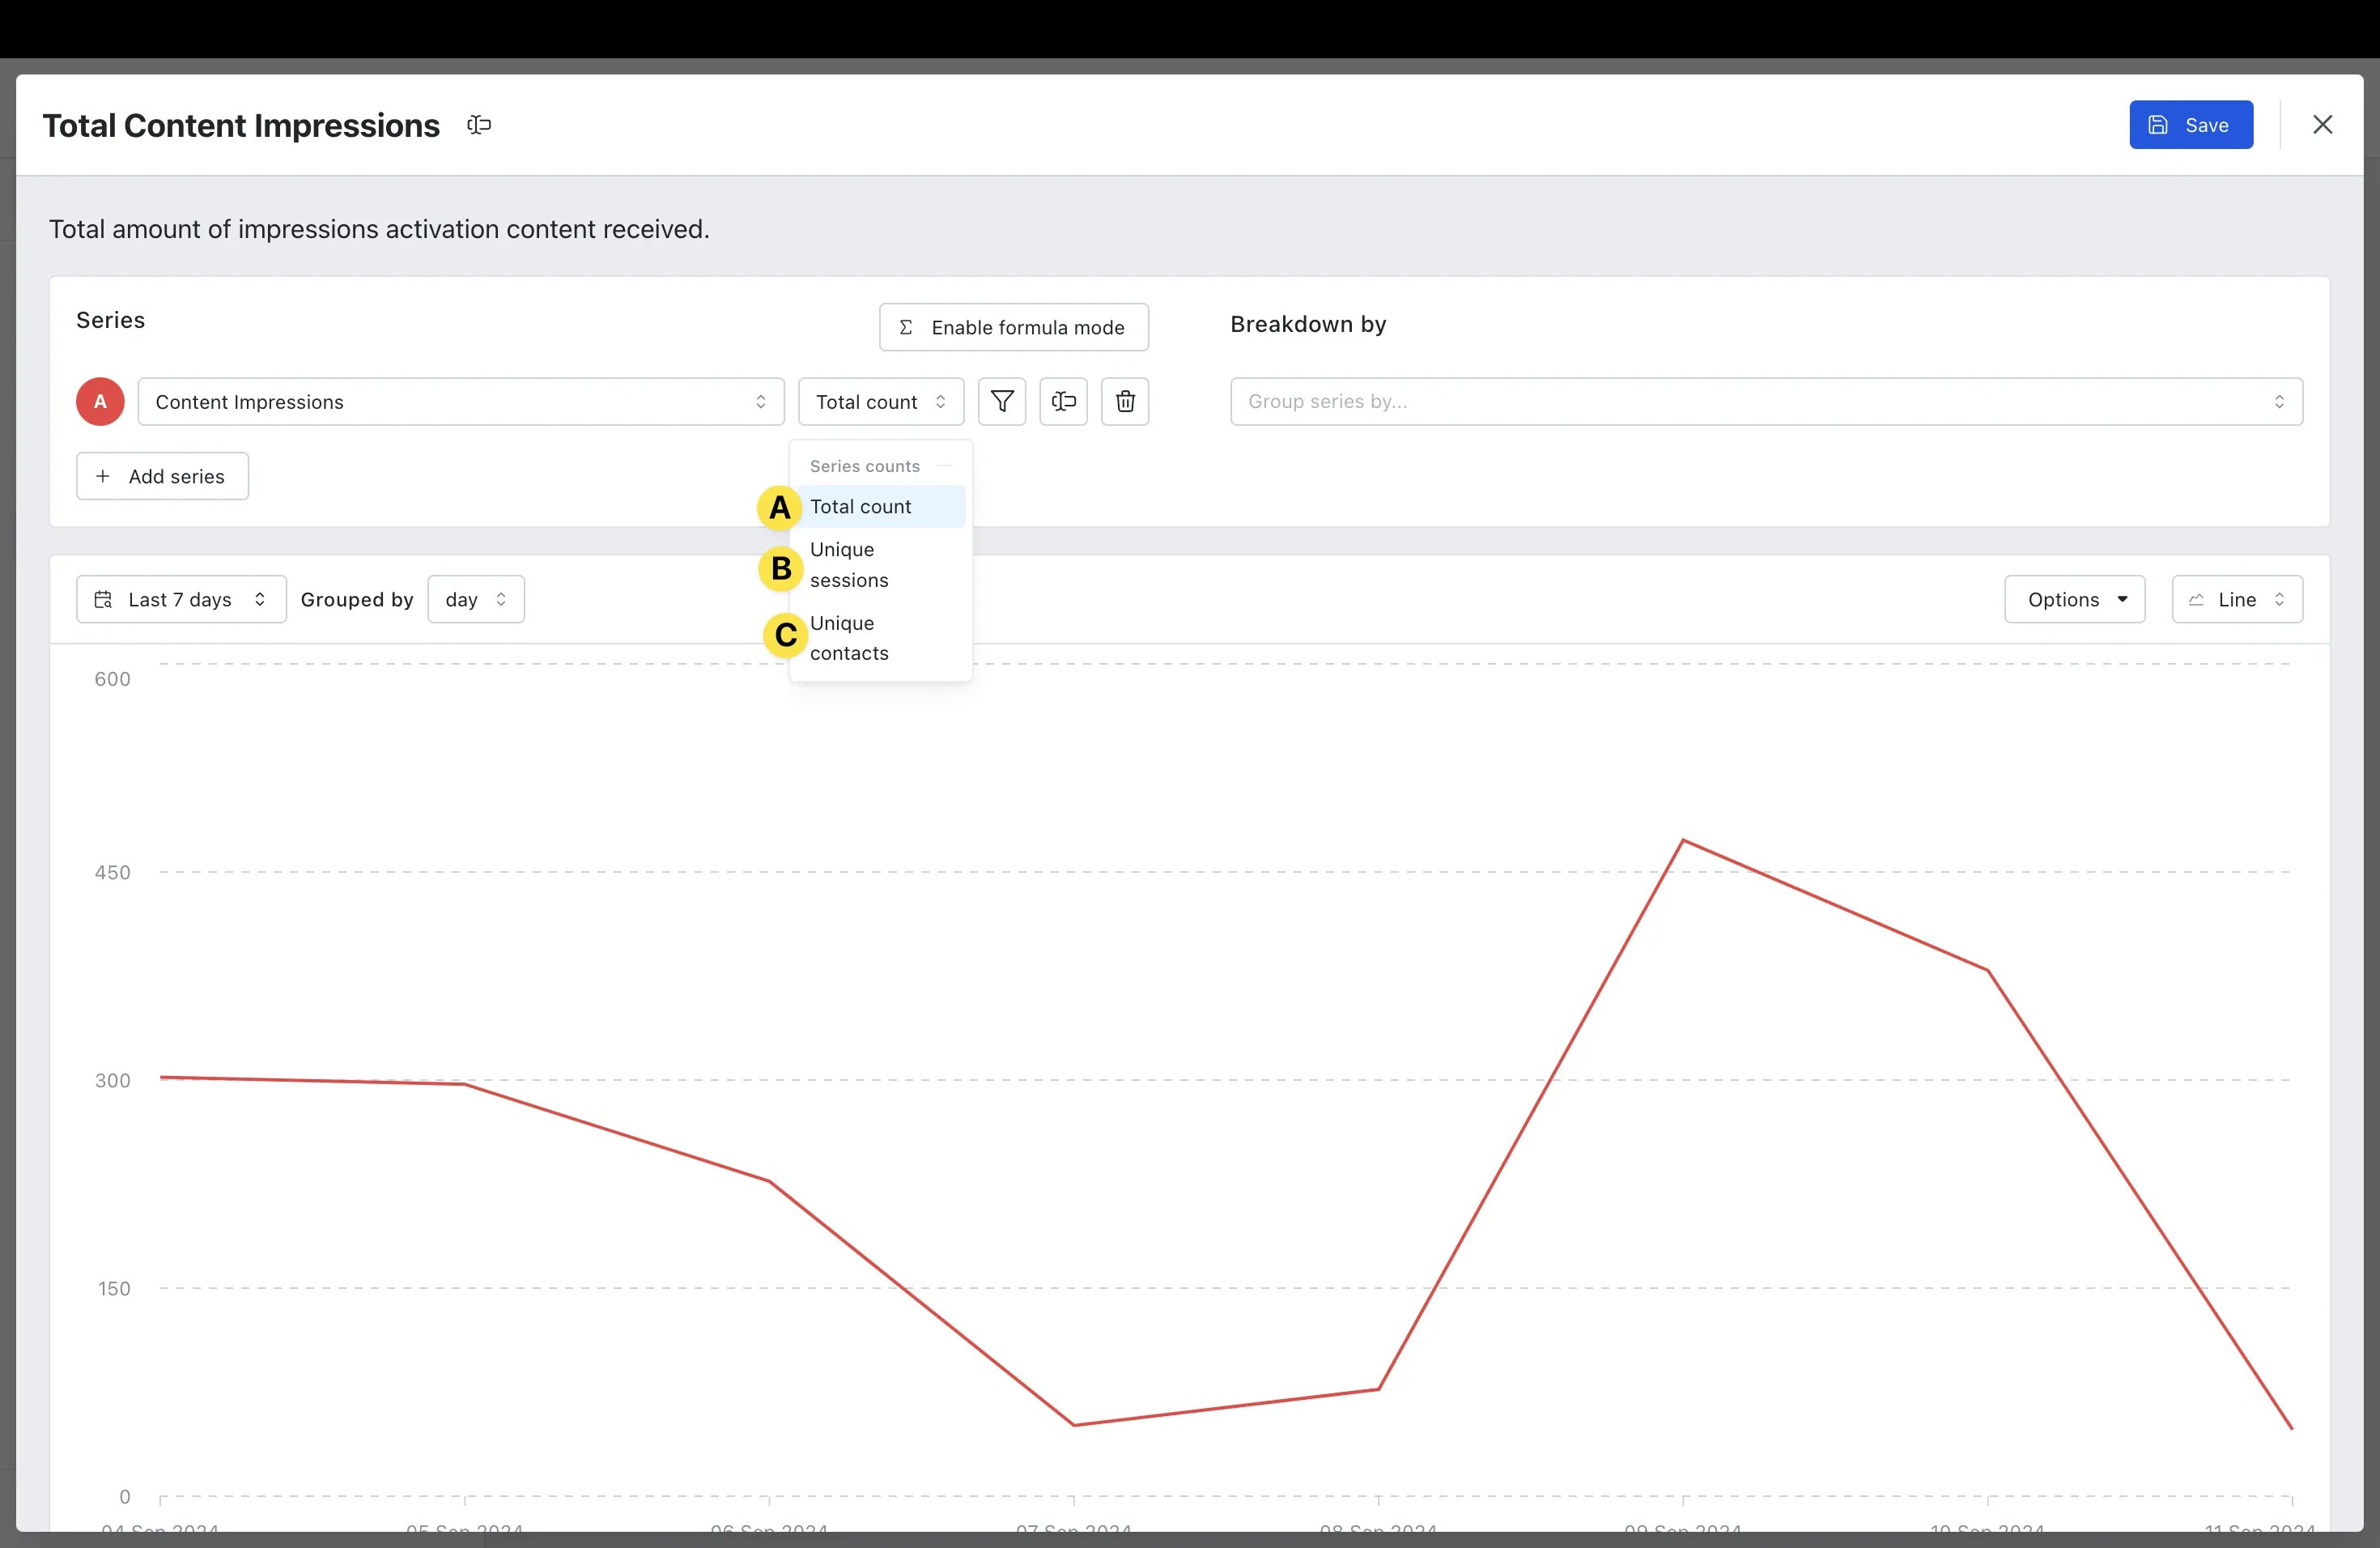 * **(A) Total count** displays the total number of series events
* **(B) Unique sessions** displays the series event by number of unique sessions
* **(C) Unique Contacts** displays the series events by the number of unique contacts
* **(5)** Here you can opt to apply **filters** to your insight
* **(A) Total count** displays the total number of series events
* **(B) Unique sessions** displays the series event by number of unique sessions
* **(C) Unique Contacts** displays the series events by the number of unique contacts
* **(5)** Here you can opt to apply **filters** to your insight
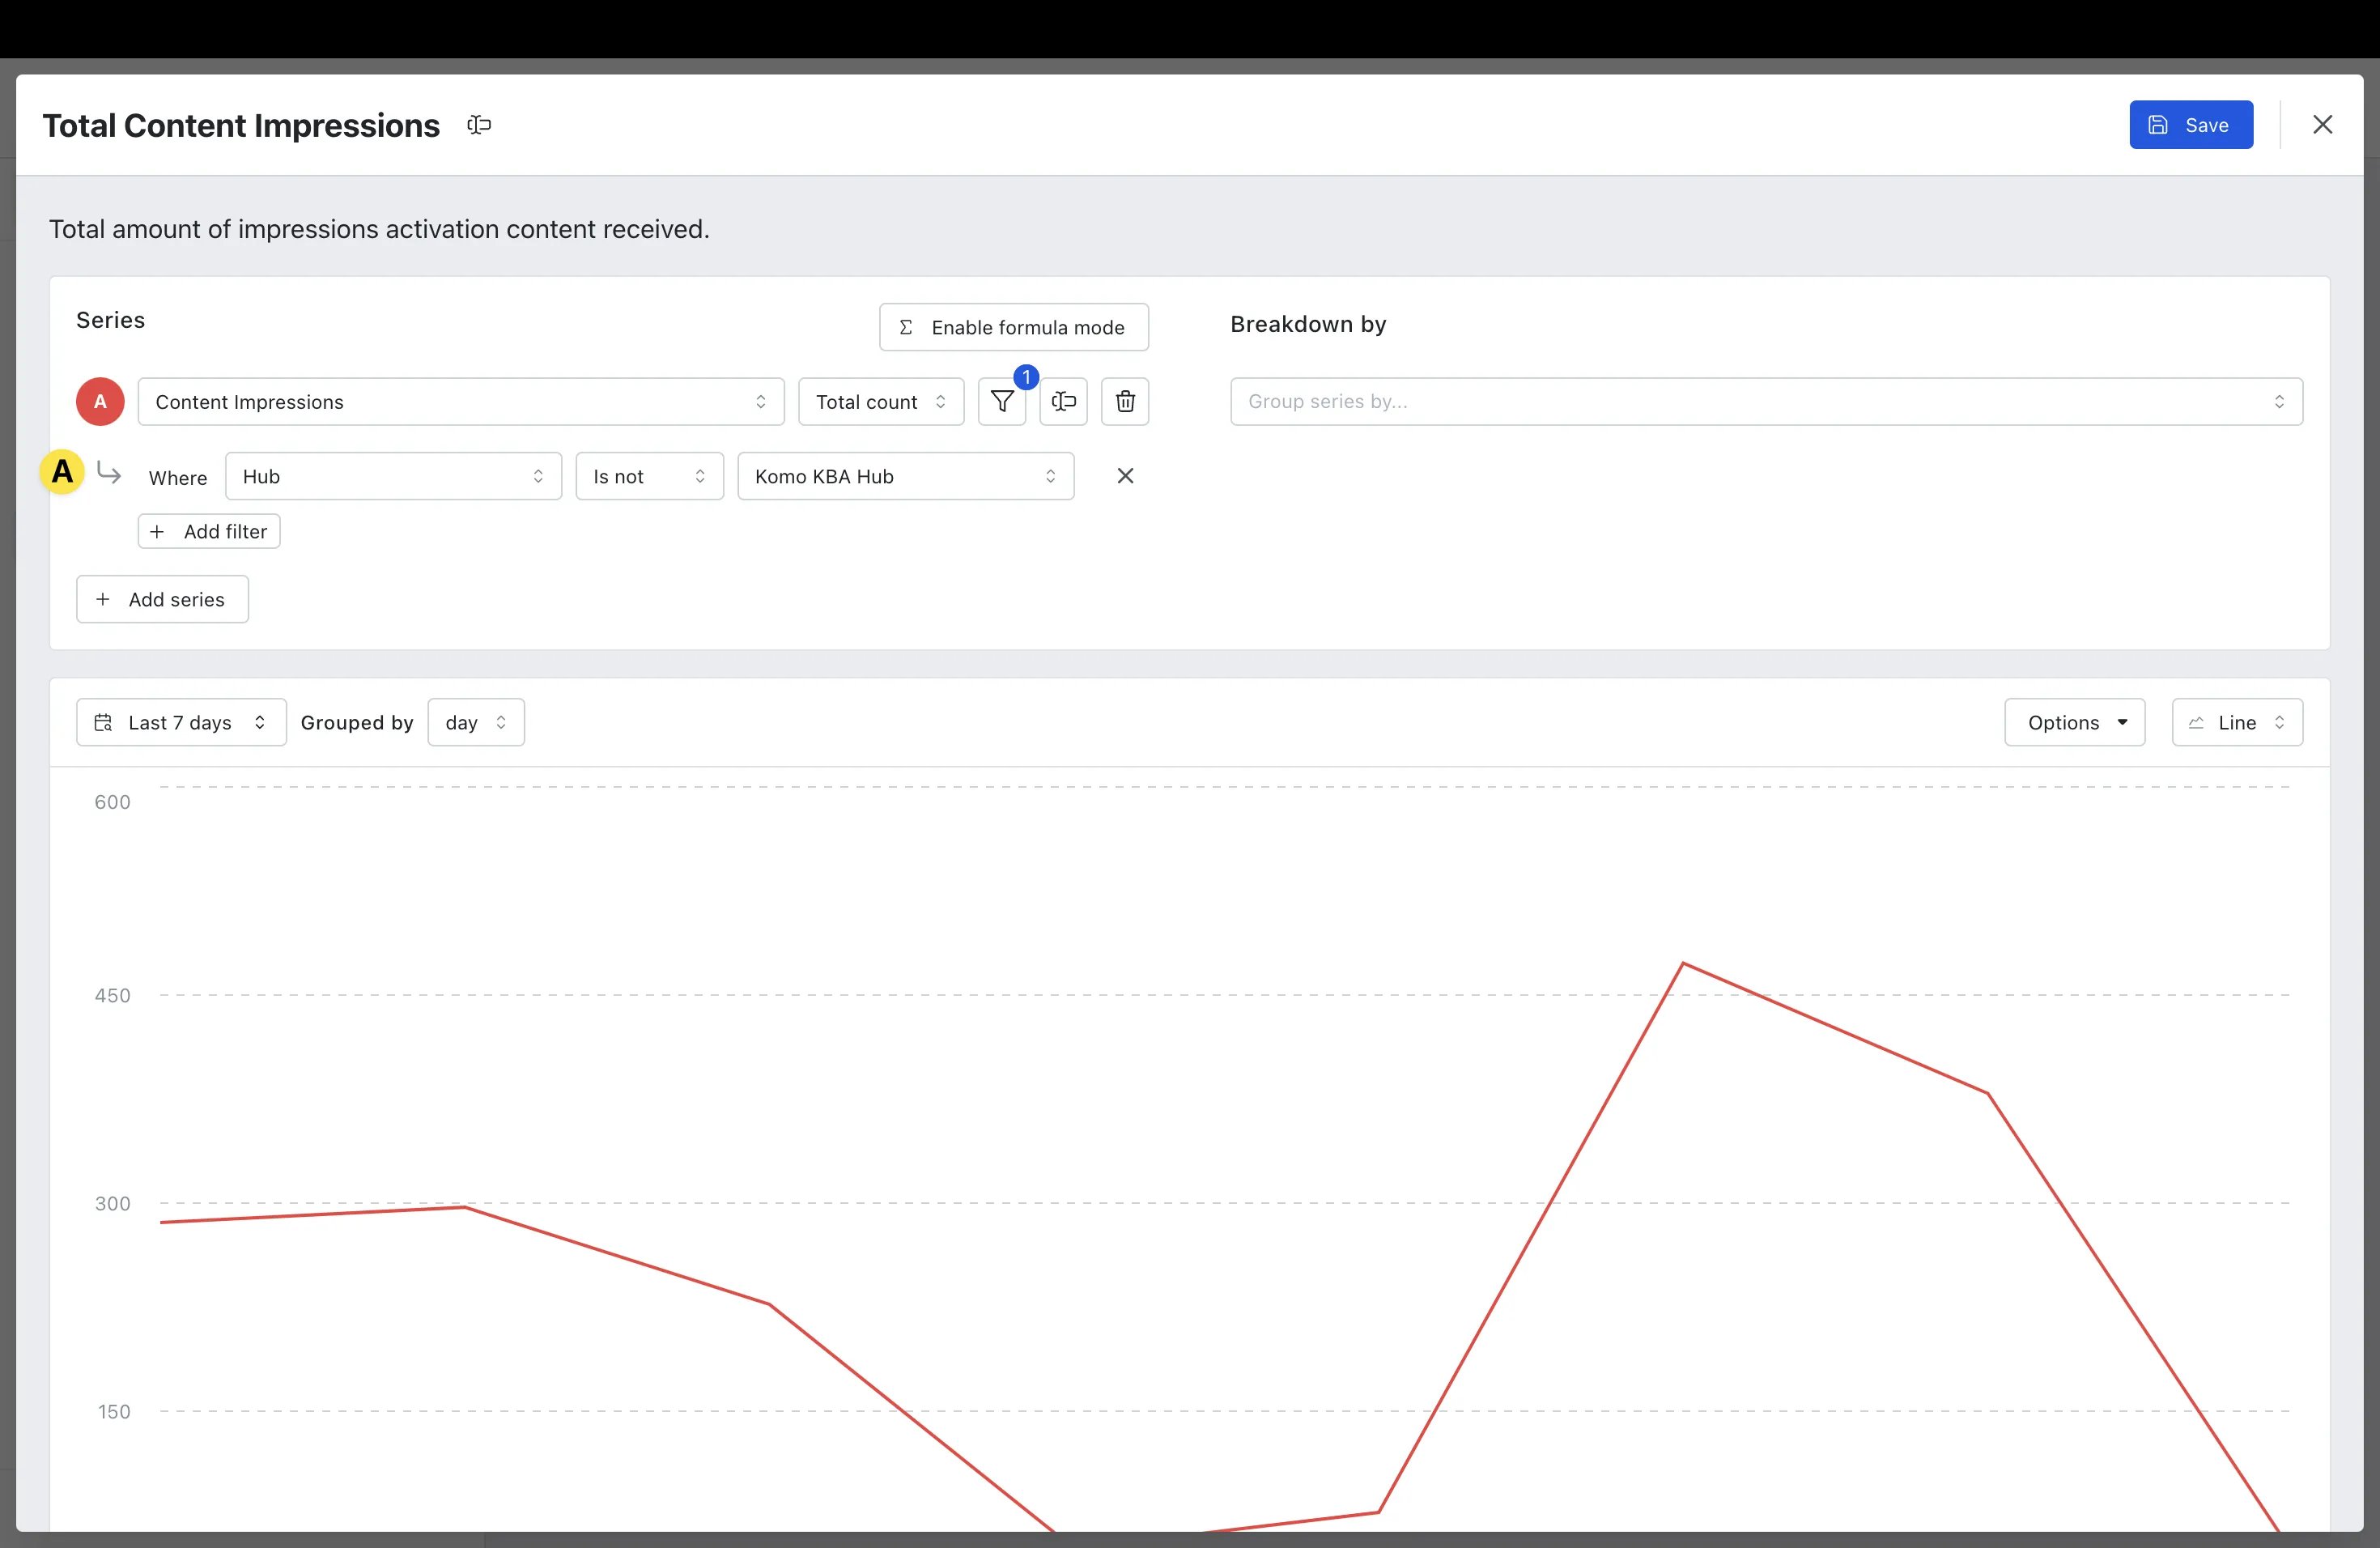 * **(A)** Here you can set the **filter parameters** for your insight
* **(6)** Here you can **rename** your series (if desired)
* **(7)** If you wish to **delete** your series, you can click the **bin icon**
* **(8)** By selecting **Enable formula mode** you can enter a formula to calculate your series data
* **(9)** Here you can opt to **breakdown** or slice your series by a range of variables
* **(10)** Click **+ Add series** to include additional series data in your insight
* **(11)** Here you can change the **time period** and **grouping** of the displayed insight
* **(12)** Click **Options** to customize how the series is displayed
* **(13)** Here you can change the **visualization format** for the series
* **(14)** View the **visualization** of your series data over time and scroll over the line to view point-in-time metrics
* **(15)** Scrolling down, you can view your series insights in **table form**
* **(16)** Here you can export the data in CSV format
* **(17)** Once satisfied with your insight parameters, click **Save**
* You will now see that your insight has been created
### Step 3: View your Insight
* **(A)** Here you can set the **filter parameters** for your insight
* **(6)** Here you can **rename** your series (if desired)
* **(7)** If you wish to **delete** your series, you can click the **bin icon**
* **(8)** By selecting **Enable formula mode** you can enter a formula to calculate your series data
* **(9)** Here you can opt to **breakdown** or slice your series by a range of variables
* **(10)** Click **+ Add series** to include additional series data in your insight
* **(11)** Here you can change the **time period** and **grouping** of the displayed insight
* **(12)** Click **Options** to customize how the series is displayed
* **(13)** Here you can change the **visualization format** for the series
* **(14)** View the **visualization** of your series data over time and scroll over the line to view point-in-time metrics
* **(15)** Scrolling down, you can view your series insights in **table form**
* **(16)** Here you can export the data in CSV format
* **(17)** Once satisfied with your insight parameters, click **Save**
* You will now see that your insight has been created
### Step 3: View your Insight
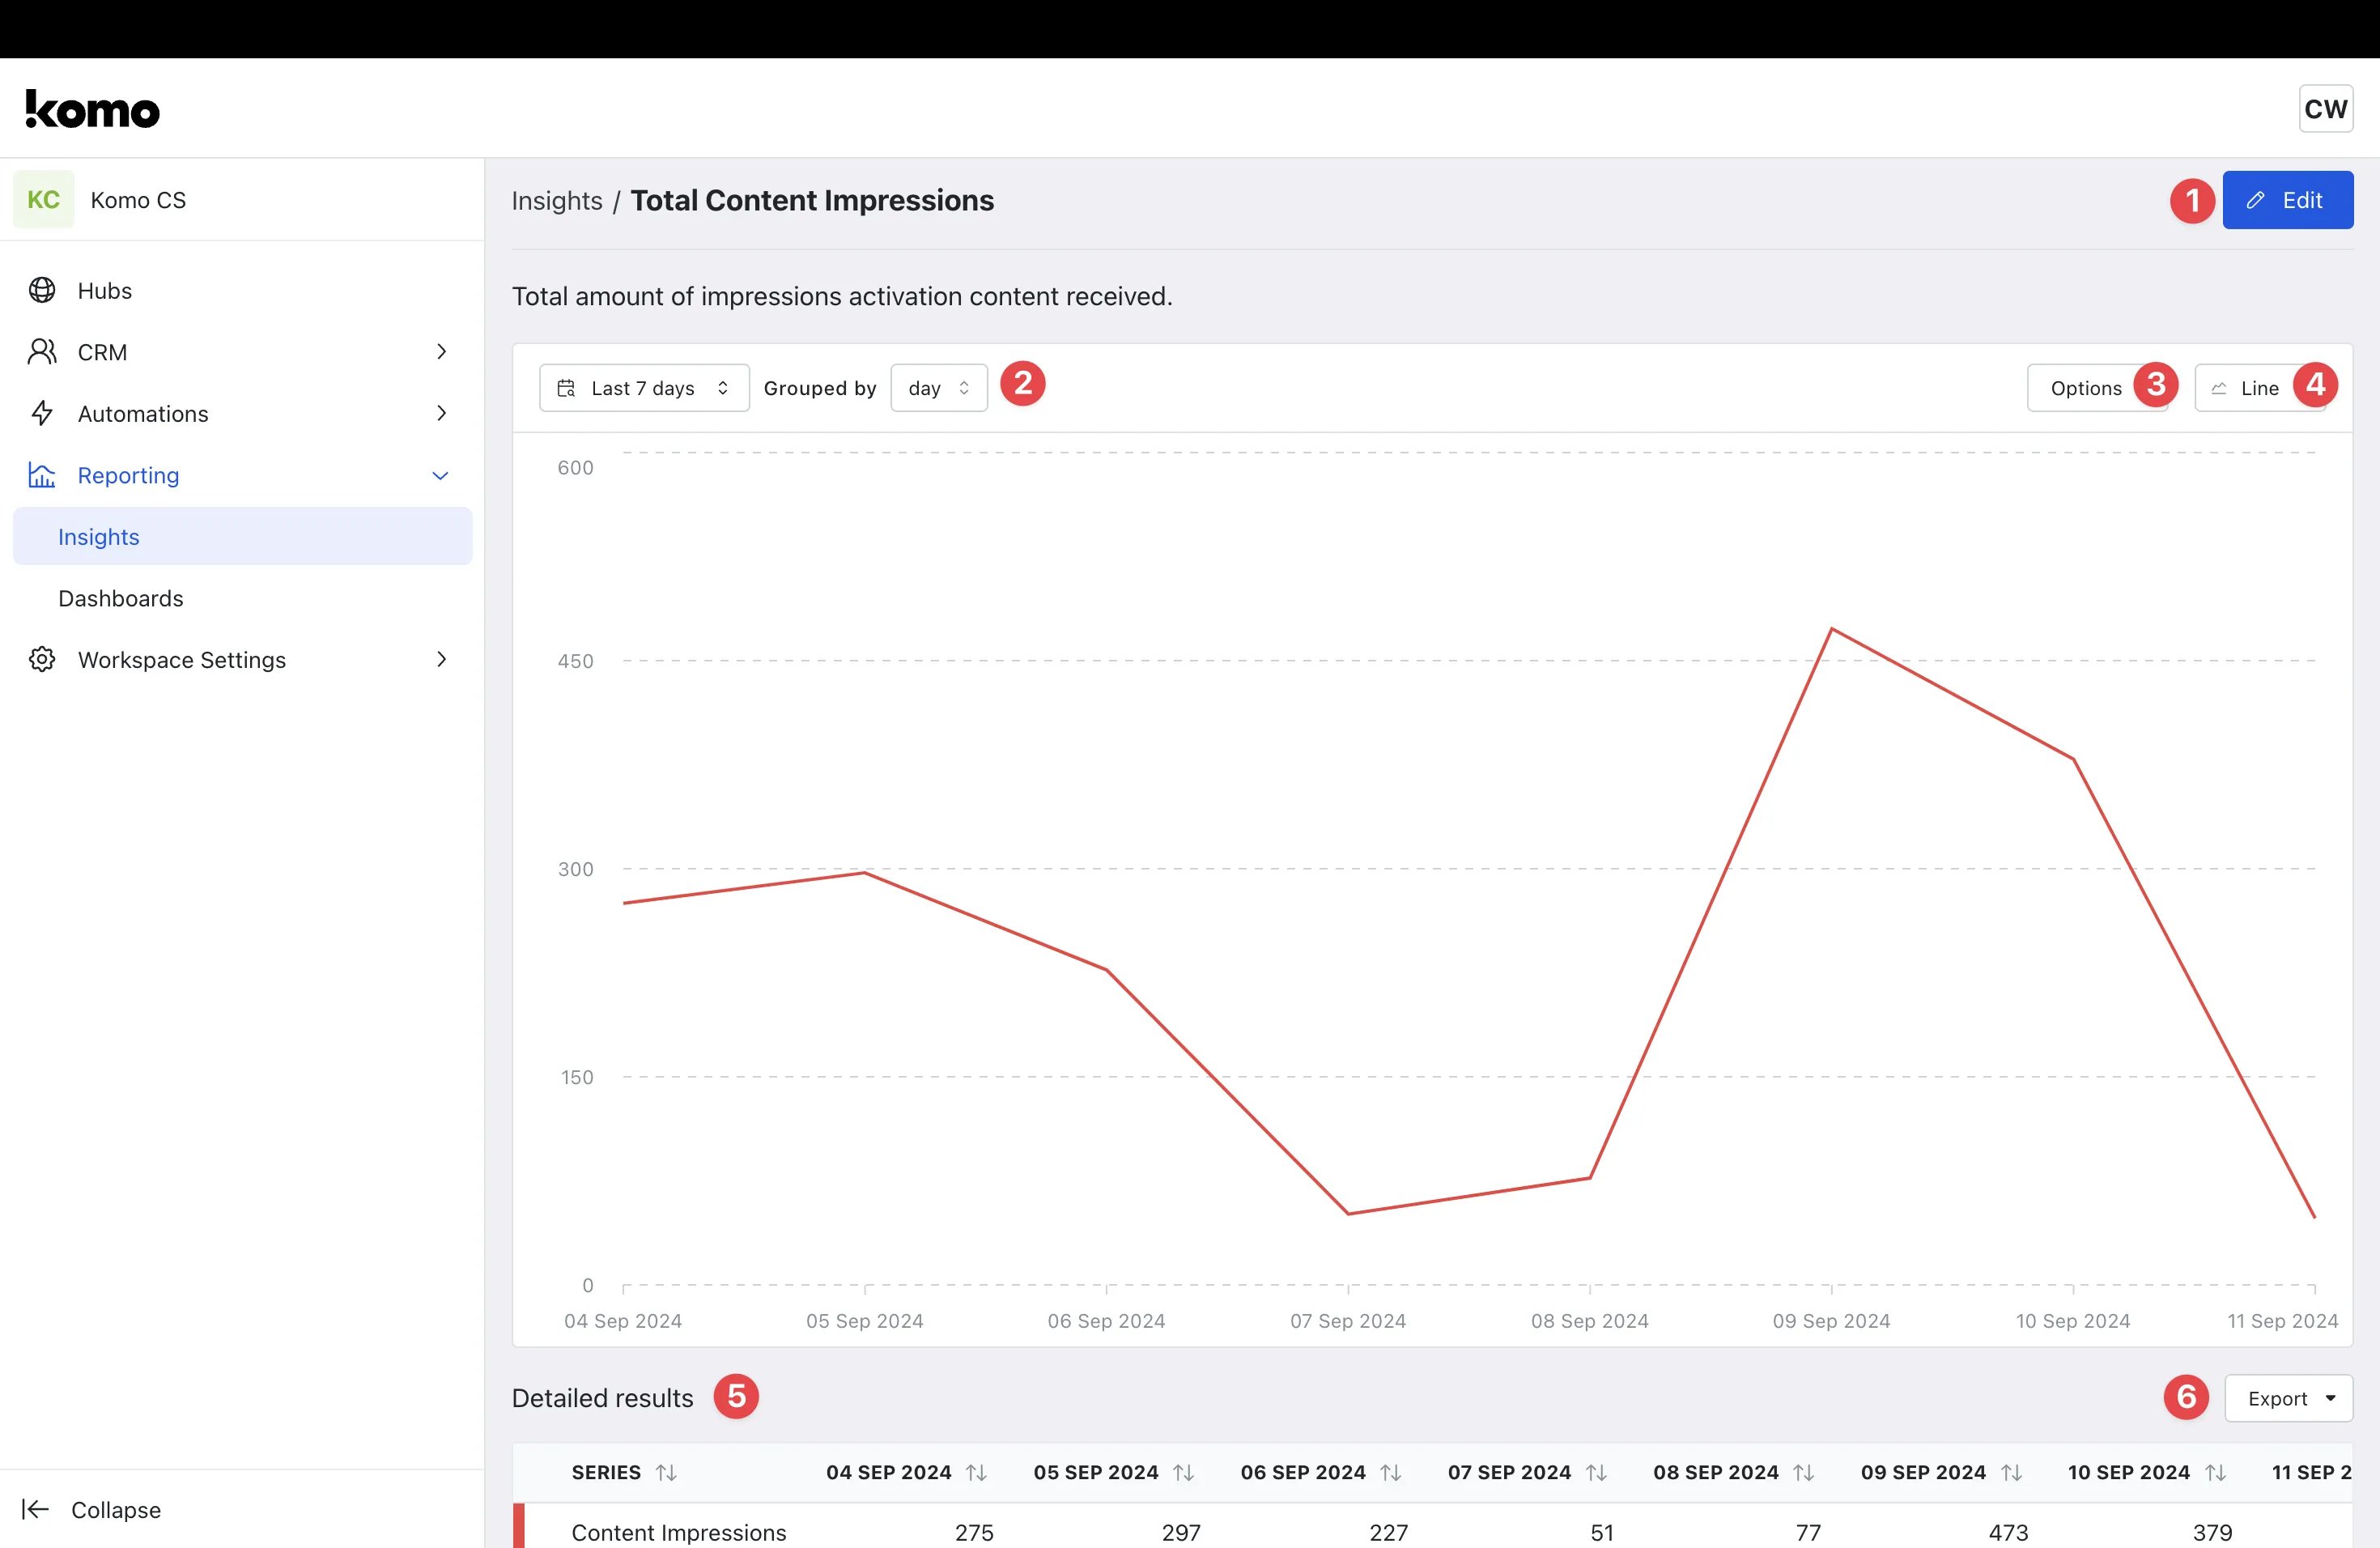 * Now that your insight is created, you have the ability to **view** and **analyze** the data
* **(1)** Click **Edit** to make any changes to the saved insight
* **(2)** Here you can change the **time period** and **grouping** displayed
* **(3)** By clicking **Options** you can customize how the insight is displayed
* **(4)** Click here to change the **visualization format** for the data
* **(5)** Here you can view the data in **table form**
* **(6)** Select **export** to export the data in a CSV format
### Step 4: Create a Dashboard
* Now that your insight is created, you have the ability to **view** and **analyze** the data
* **(1)** Click **Edit** to make any changes to the saved insight
* **(2)** Here you can change the **time period** and **grouping** displayed
* **(3)** By clicking **Options** you can customize how the insight is displayed
* **(4)** Click here to change the **visualization format** for the data
* **(5)** Here you can view the data in **table form**
* **(6)** Select **export** to export the data in a CSV format
### Step 4: Create a Dashboard
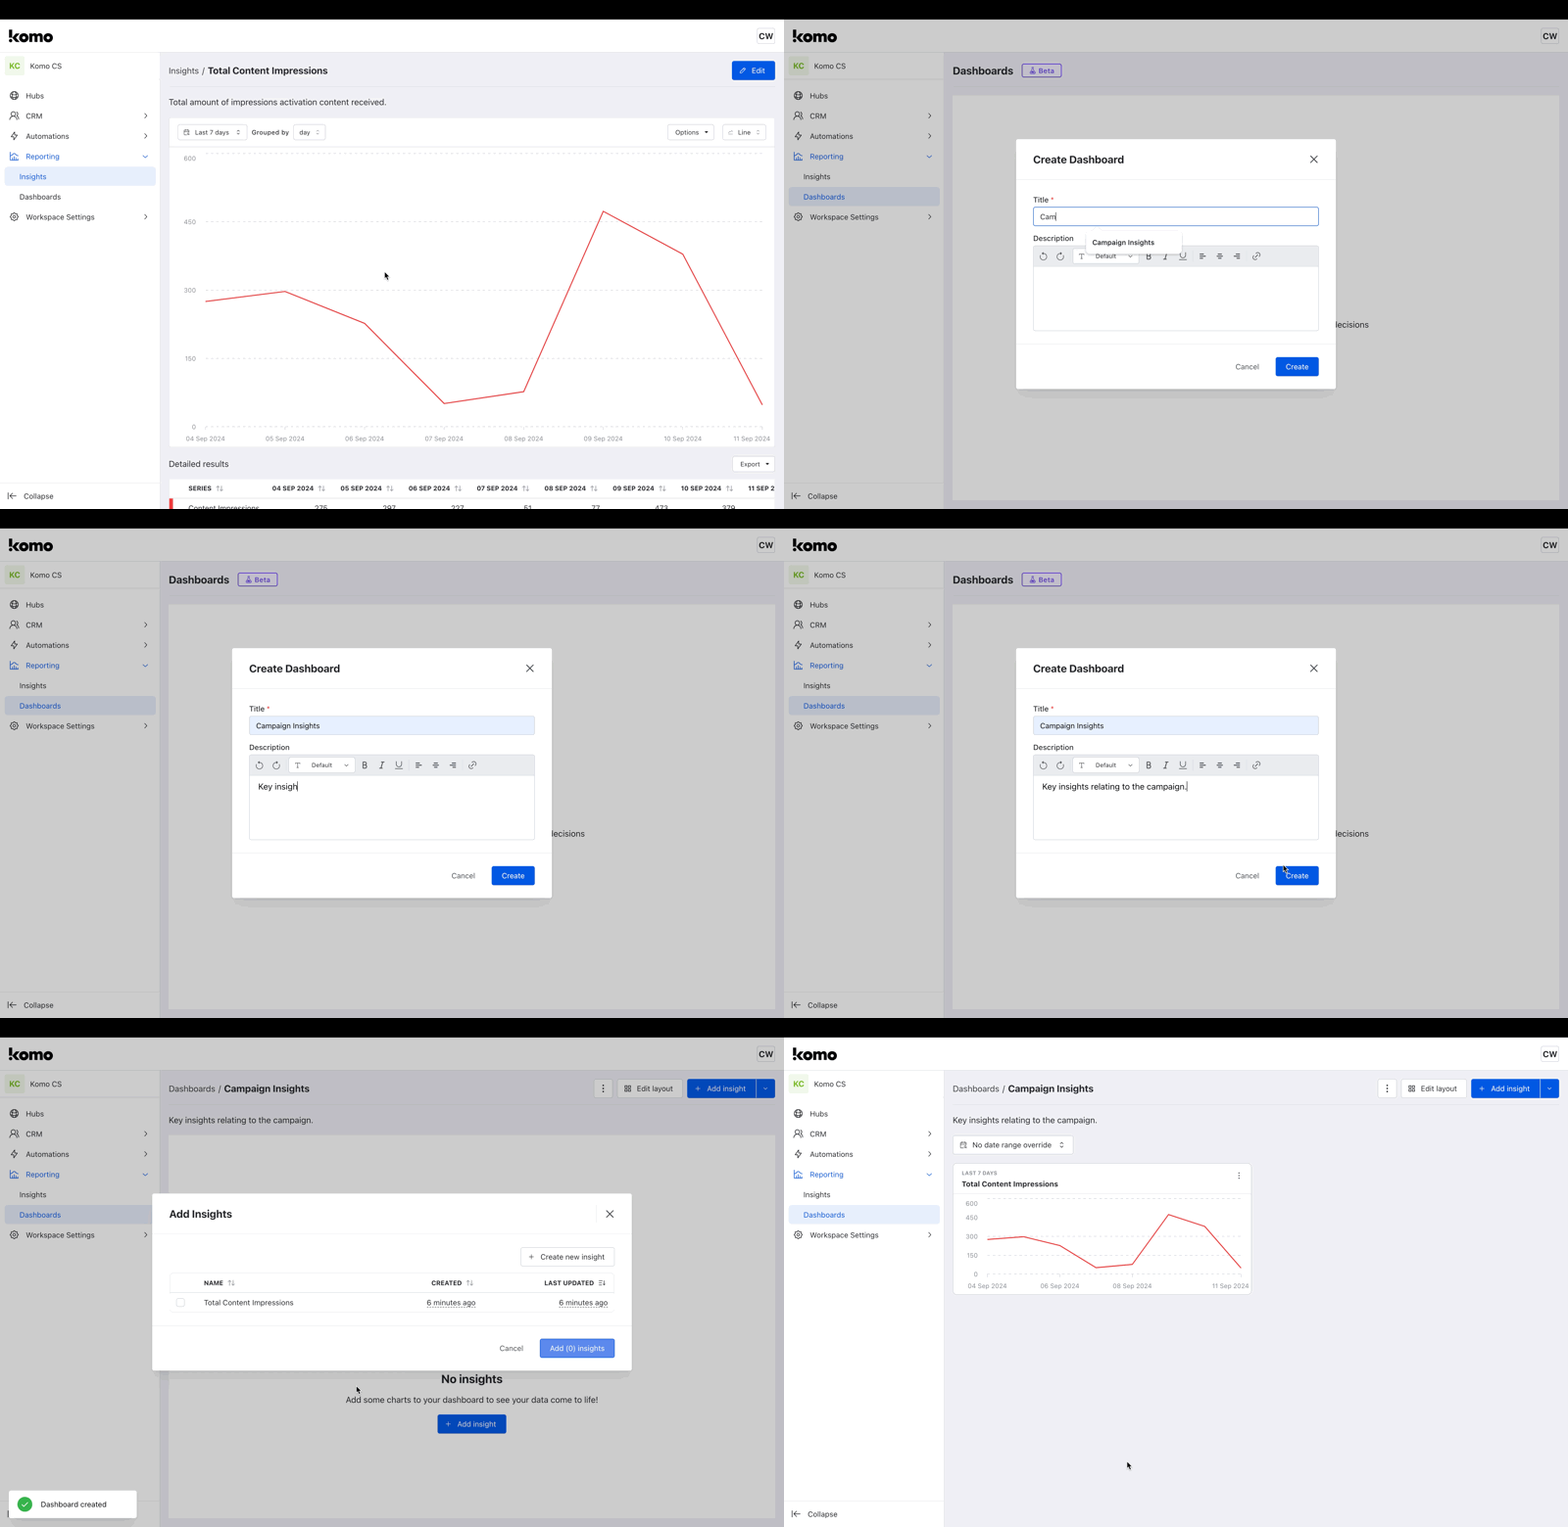 * After creating one (or multiple) insights, you can create custom dashboards, centralizing your insights in a single view
* Navigate to **Dashboard** (located under Reporting in the left-hand column)
* Click **+ Create Dashboard**
* Give your dashboard a relevant **Name** and **Description** and select **Create**
* Click **+ Add insight**
* Add the insight(s) you wish to display on the dashboard by selecting the **checkbox** next to the insight name
* Click **Add (x) insights**
* You will now see your newly created dashboard with the desired insights displayed
### Step 5: View your Dashboard
* After creating one (or multiple) insights, you can create custom dashboards, centralizing your insights in a single view
* Navigate to **Dashboard** (located under Reporting in the left-hand column)
* Click **+ Create Dashboard**
* Give your dashboard a relevant **Name** and **Description** and select **Create**
* Click **+ Add insight**
* Add the insight(s) you wish to display on the dashboard by selecting the **checkbox** next to the insight name
* Click **Add (x) insights**
* You will now see your newly created dashboard with the desired insights displayed
### Step 5: View your Dashboard
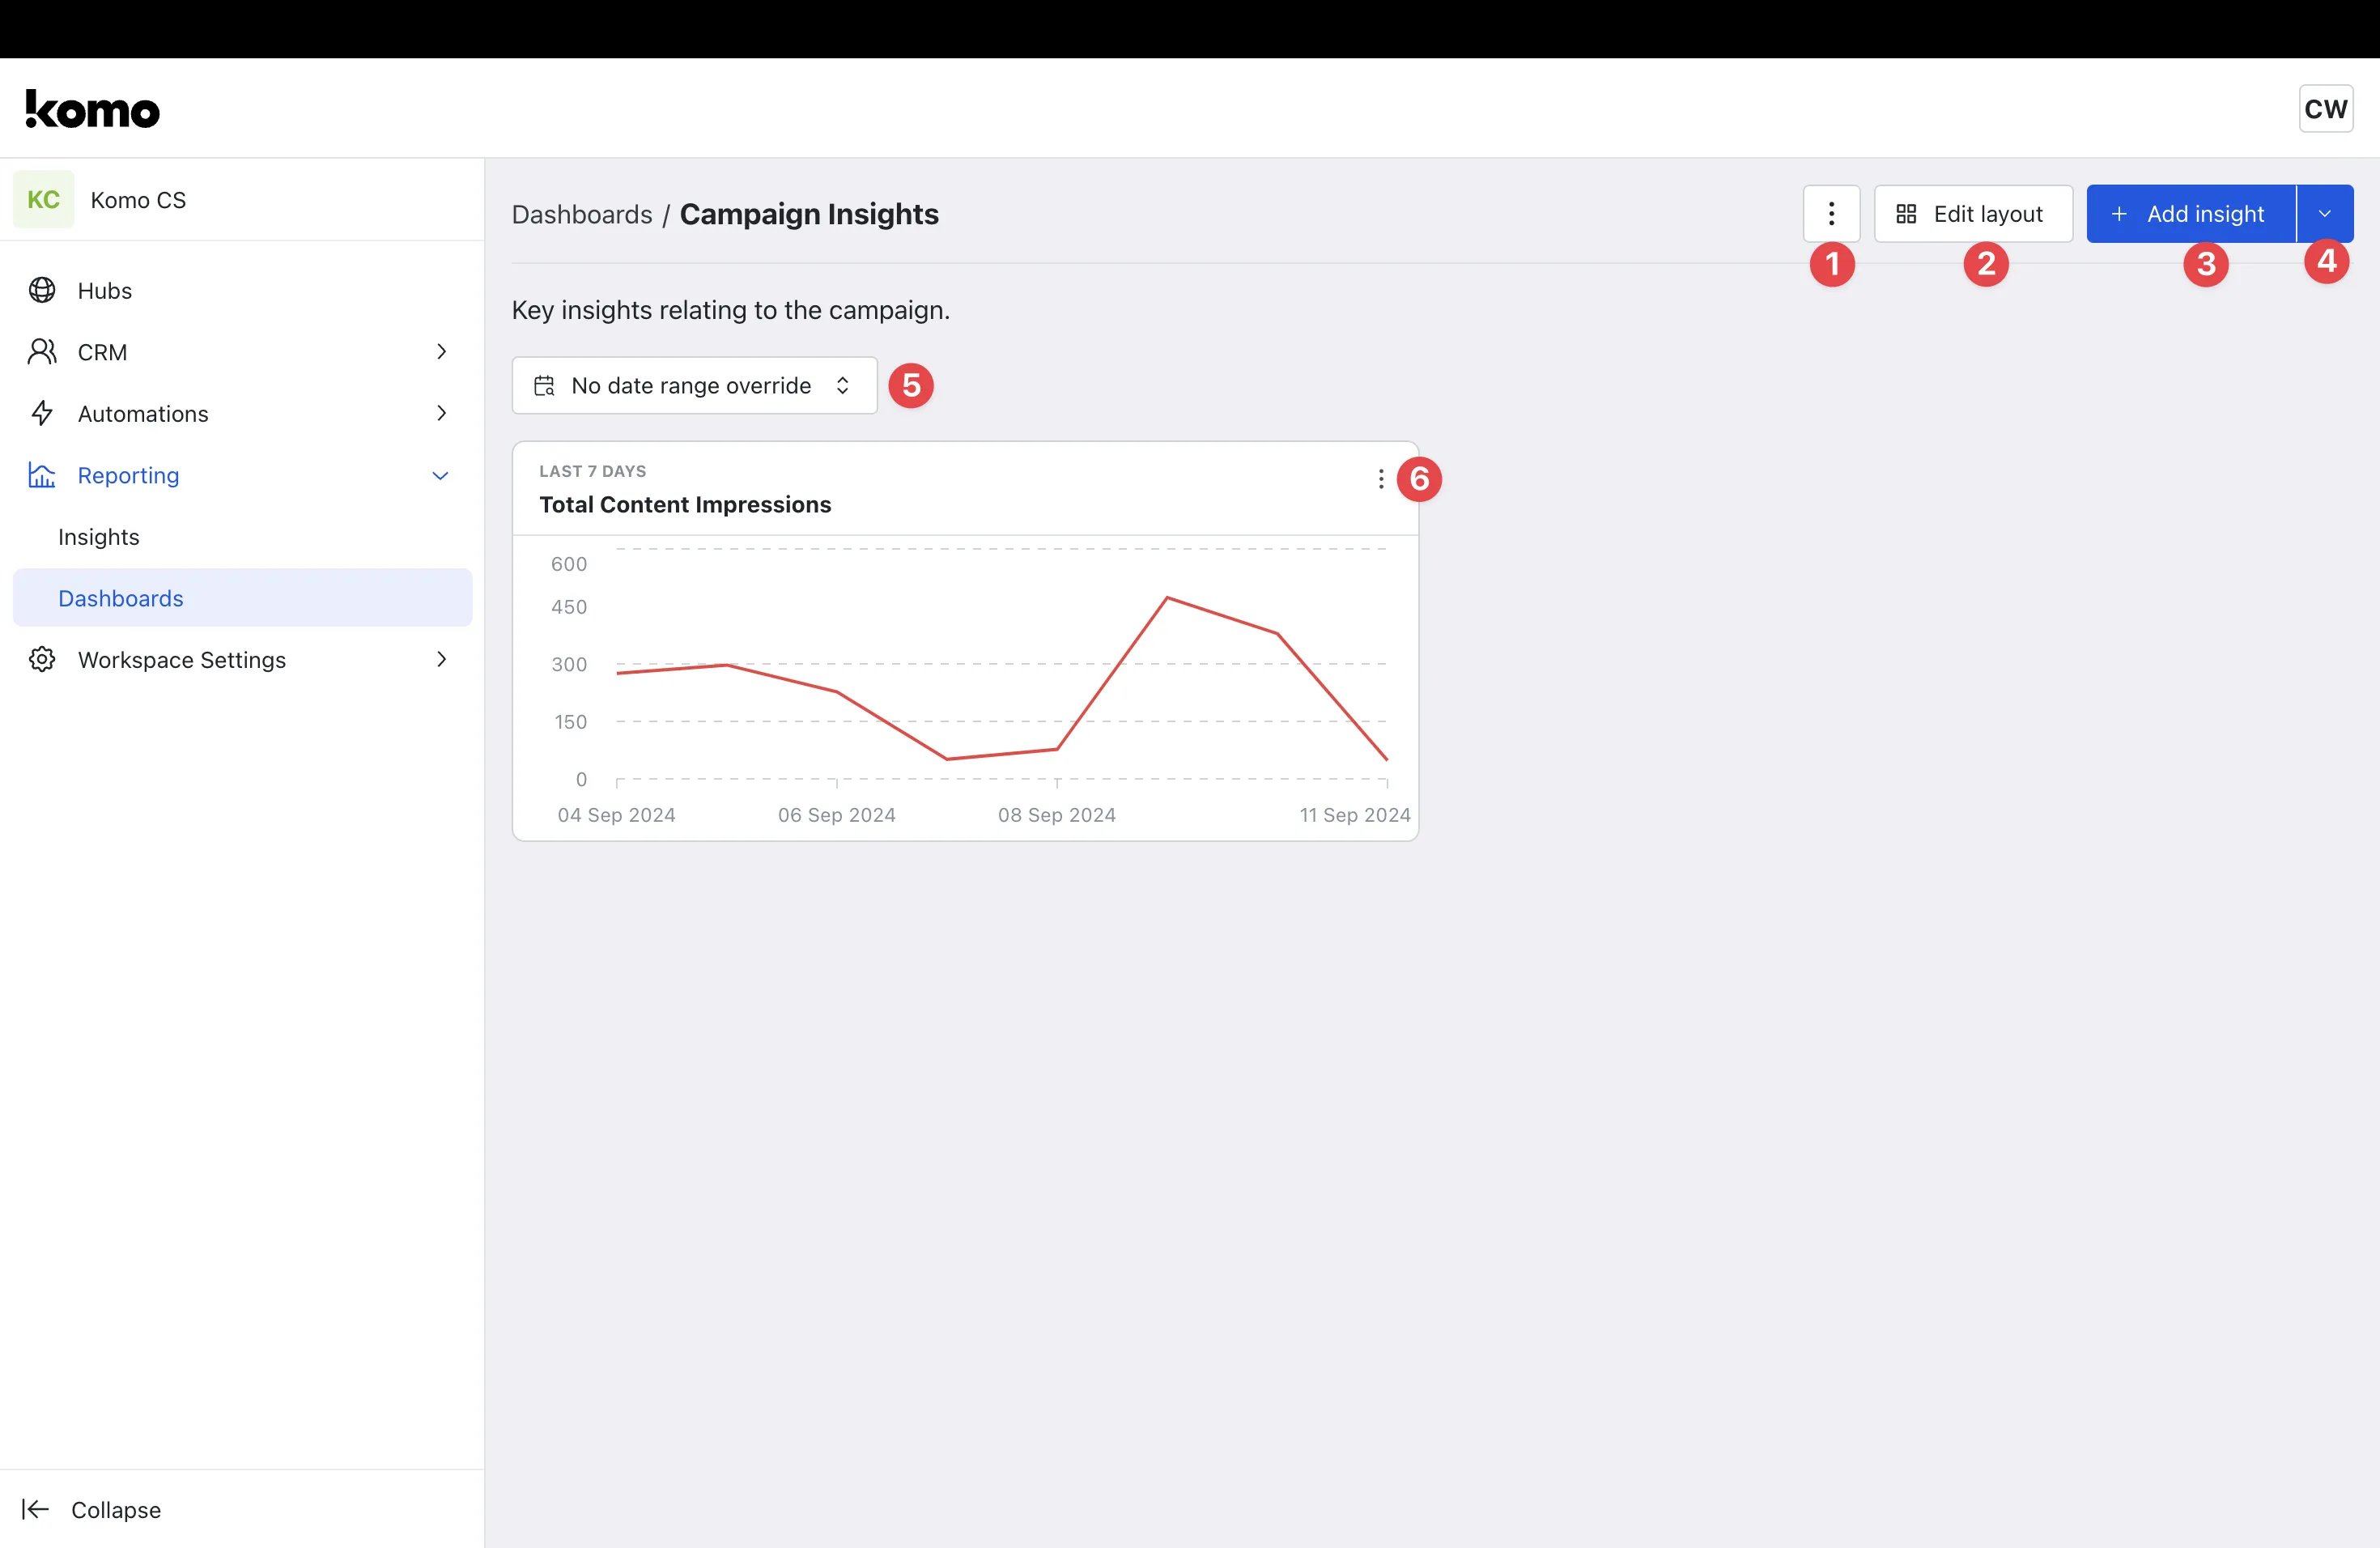 * You can now view and customize your dashboard as desired
* **(1)** Click the **three dots** to **Rename, Clone**, or **Delete** the dashboard
* **(2)** You can reorganize how the dashboard displays by selecting **Edit layout** and **dragging** and **dropping** the insight modules as desired
* **(3)** Click **+ Add insight** if you wish to include additional insights on your dashboard
* **(4)** Here you can **Add a text widget** that can be used to leave comments, annotations, and titles on your dashboard
* **(5)** Click here to change the **time period** displayed for the insights
* **(6)** Click the **three dots** to **edit, view**, or **delete** individual insights
## FAQ
**What is a series?**
A series refers to a sequence of related data points collected or observed over a period of time or across different categories. It can be presented as a time series or categorical series depending on the nature of the data.
**Why are Insights and Dashboards in Beta?**
Insights and Dashboards are currently in Beta, as we are looking to gather customer feedback on the capability to ensure it is as valuable and powerful as possible. If you have any feedback, please reach out directly to your Customer Success Manager. All feedback will be considered as we make improvements to the feature over time.
* You can now view and customize your dashboard as desired
* **(1)** Click the **three dots** to **Rename, Clone**, or **Delete** the dashboard
* **(2)** You can reorganize how the dashboard displays by selecting **Edit layout** and **dragging** and **dropping** the insight modules as desired
* **(3)** Click **+ Add insight** if you wish to include additional insights on your dashboard
* **(4)** Here you can **Add a text widget** that can be used to leave comments, annotations, and titles on your dashboard
* **(5)** Click here to change the **time period** displayed for the insights
* **(6)** Click the **three dots** to **edit, view**, or **delete** individual insights
## FAQ
**What is a series?**
A series refers to a sequence of related data points collected or observed over a period of time or across different categories. It can be presented as a time series or categorical series depending on the nature of the data.
**Why are Insights and Dashboards in Beta?**
Insights and Dashboards are currently in Beta, as we are looking to gather customer feedback on the capability to ensure it is as valuable and powerful as possible. If you have any feedback, please reach out directly to your Customer Success Manager. All feedback will be considered as we make improvements to the feature over time.