Contents
What is it?
Our Analytics modal is designed to empower our customers with valuable insights into the performance of their Komo campaigns. With a focus on data-driven decision-making, this modal offers comprehensive and intuitive analytics that unlock a deeper understanding of campaign effectiveness and audience engagement.
Through a user-friendly interface, you can gain access to a wealth of key performance indicators, including impressions, engagements, engagement rate, entries, location, etc.
Komo analytics pertain to both your entire Hub and individual Cards.
How do I use it?
Accessing Hub-Level Analytics:
Navigate to Hub-Level Analytics
- From your company homepage, navigate to your Engagement Hub and click on analytics in the top navigation.
Note: We've used our Knowledge Base Hub as an example here! This Hub is only used internally.
Term definitions & navigation
- Let's go over the key navigation of this modal first up!
- (1) Here you can set the date and time range you wish to apply to your analytics.
- (2) Here you can download a .CSV file of your Hub's users.
- (3) This line graph shows the number of unique impressions, engagements and entries across your Hub along the timeline you set in Step 1.
- (4) Here, you can choose to filter your analytics by all users, signed-up users or non-signed-up users.
Note: These options will only appear if you have User Accounts Enabled. This feature is available for Growth subscriptions and above.
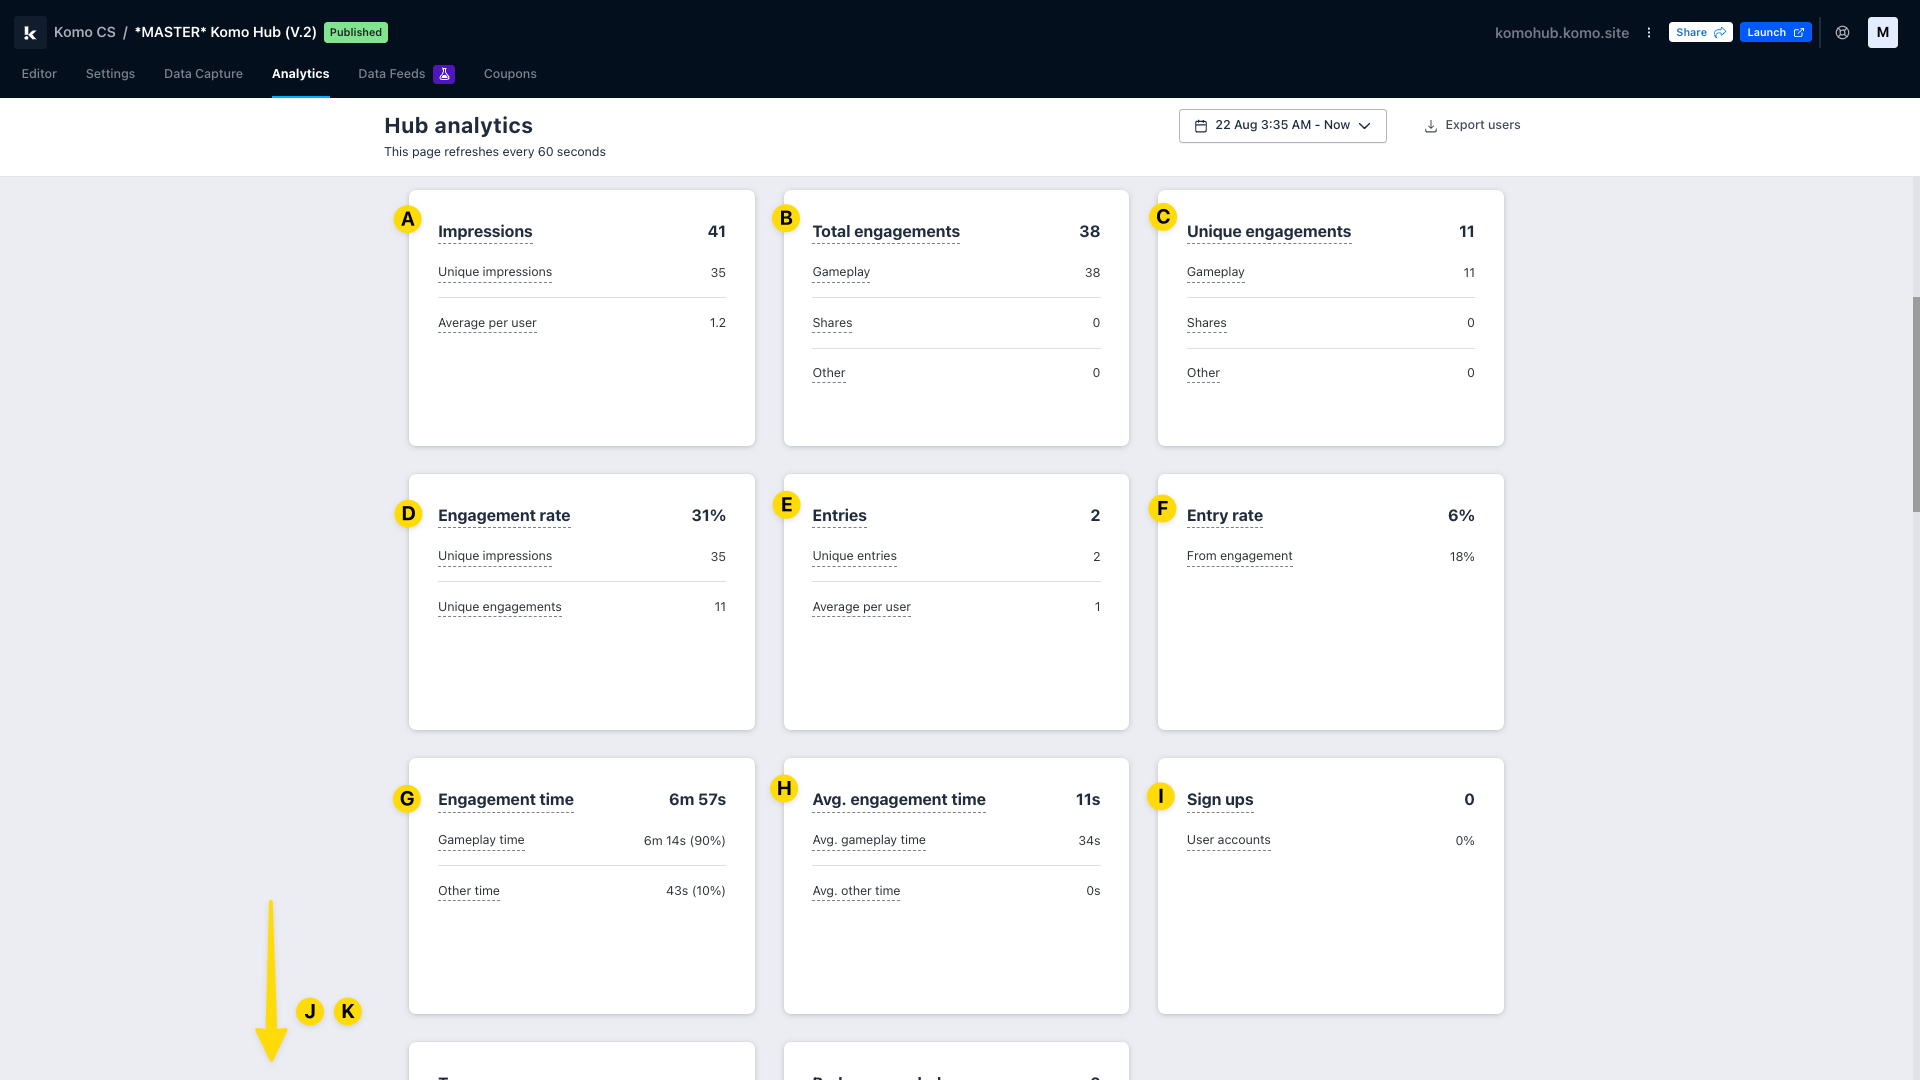
- As you scroll down, you will begin to see your Hub's key live statistics, in line with the filtering you may have set above. Note that hovering over a term will provide you with its definition! But we'll define them for you here too.
- (A) Impressions: The total number of times your Hub URL has been loaded.
- (B) Total Engagements: The total number of times your users have engaged with your content. This tracks every click on your Hub, including gameplay clicks, like items picks on the Picker Card!
- (C) Unique Engagements: The number of unique users that have engaged with your content.
- (D) Engagement Rate: The number of times that users engaged with your content as a percentage of impressions. Unique engagements / unique impressions.
- (E) Entries: The total number of data capture entries.
- (F) Entry Rate: The number of unique entries as a percentage of impressions. Unique entries / unique impressions.
- (G) Engagement Time: The total amount of time users spent engaged with all content across your Hub.
- (H) Average Engagement Time: The average amount of time each user spent engaged with any content on your Hub. Total engagement time / unique impressions.
- (I) Sign-Ups: The total number of user accounts created during the reporting period.
- (J) Top Sources: Where your Hub impressions come from. This stat users referrer, UTM source and UTM medium parameters to determine sources.
- (K) Badges Awarded: Where you can view the number of Badges awarded across your Hub, separated into individual Badges within Badge Variants. Please note that this will only appear if you are using Badges on your Hub.
-
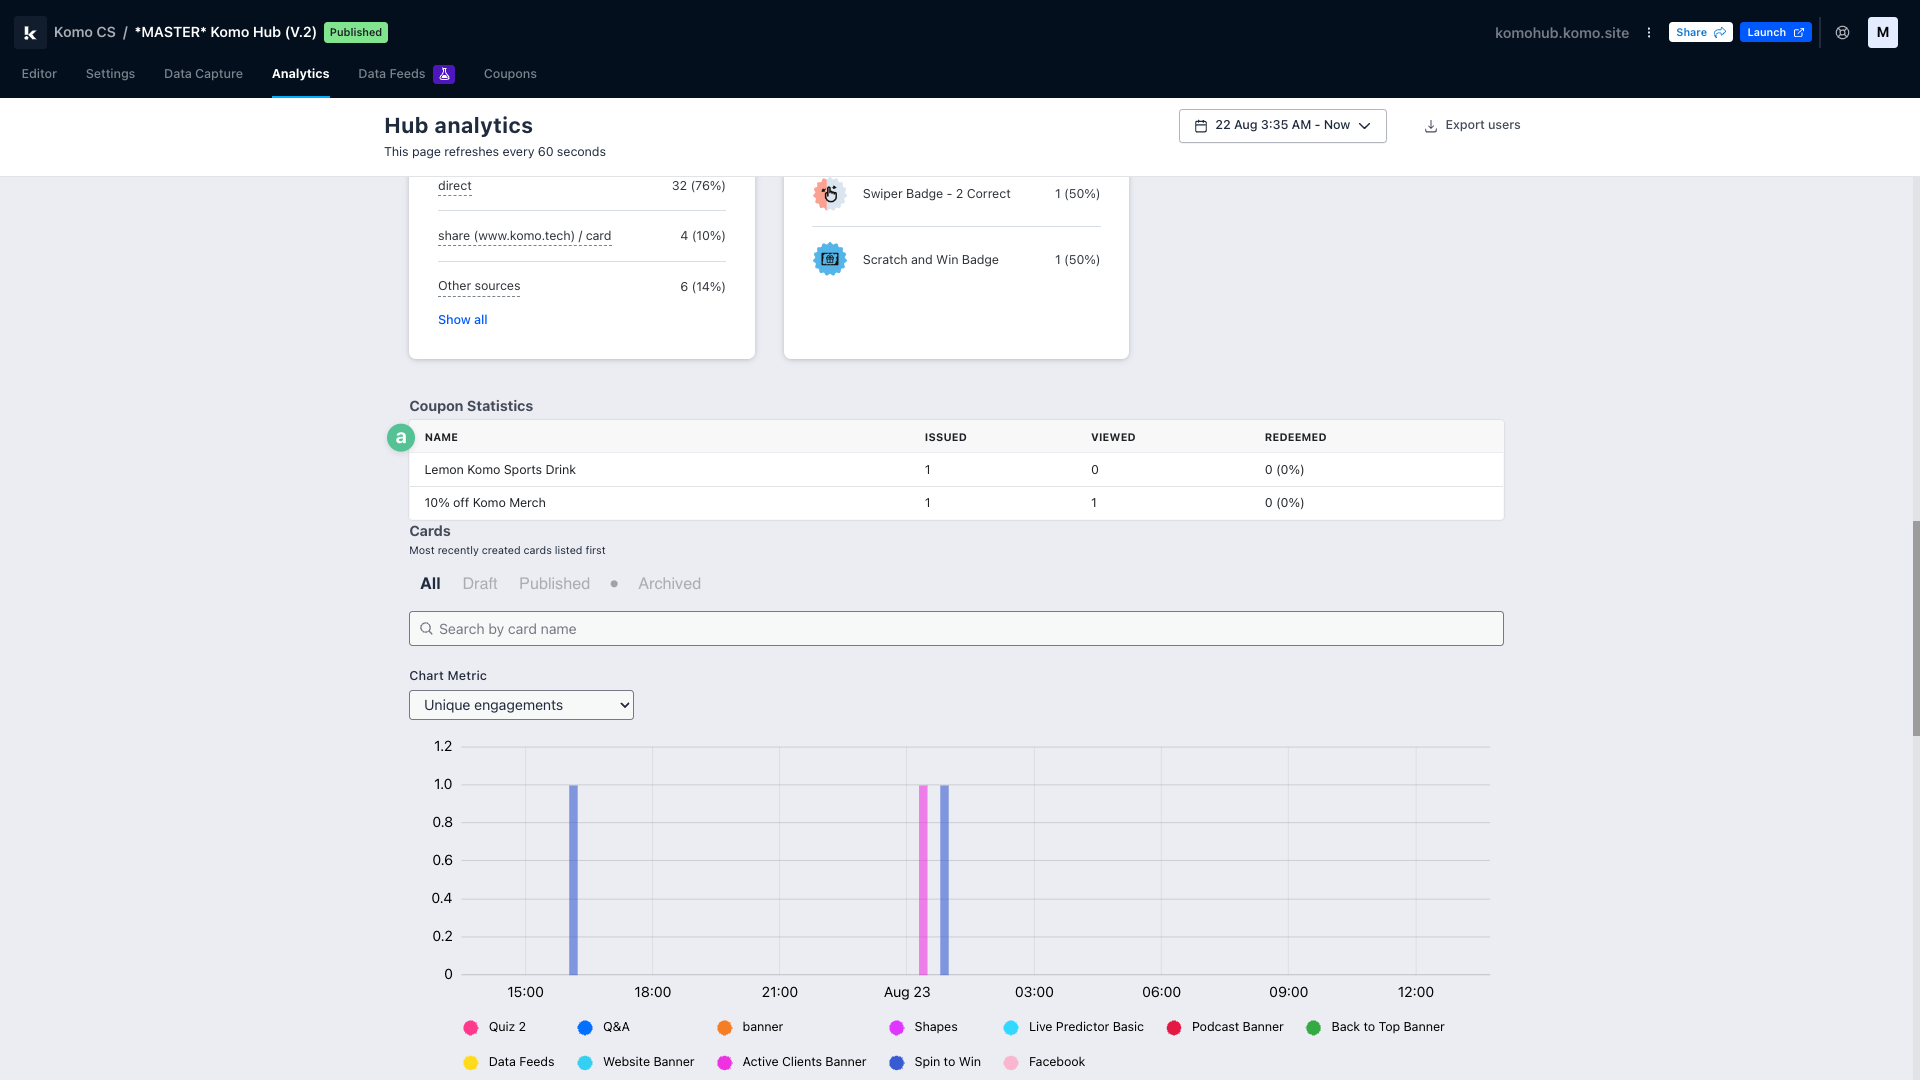
- (a) Coupons Statistics: If you are using Digital Coupons on your Hub, here you will see a breakdown of the Coupons issued, viewed and redeemed across your Cards.
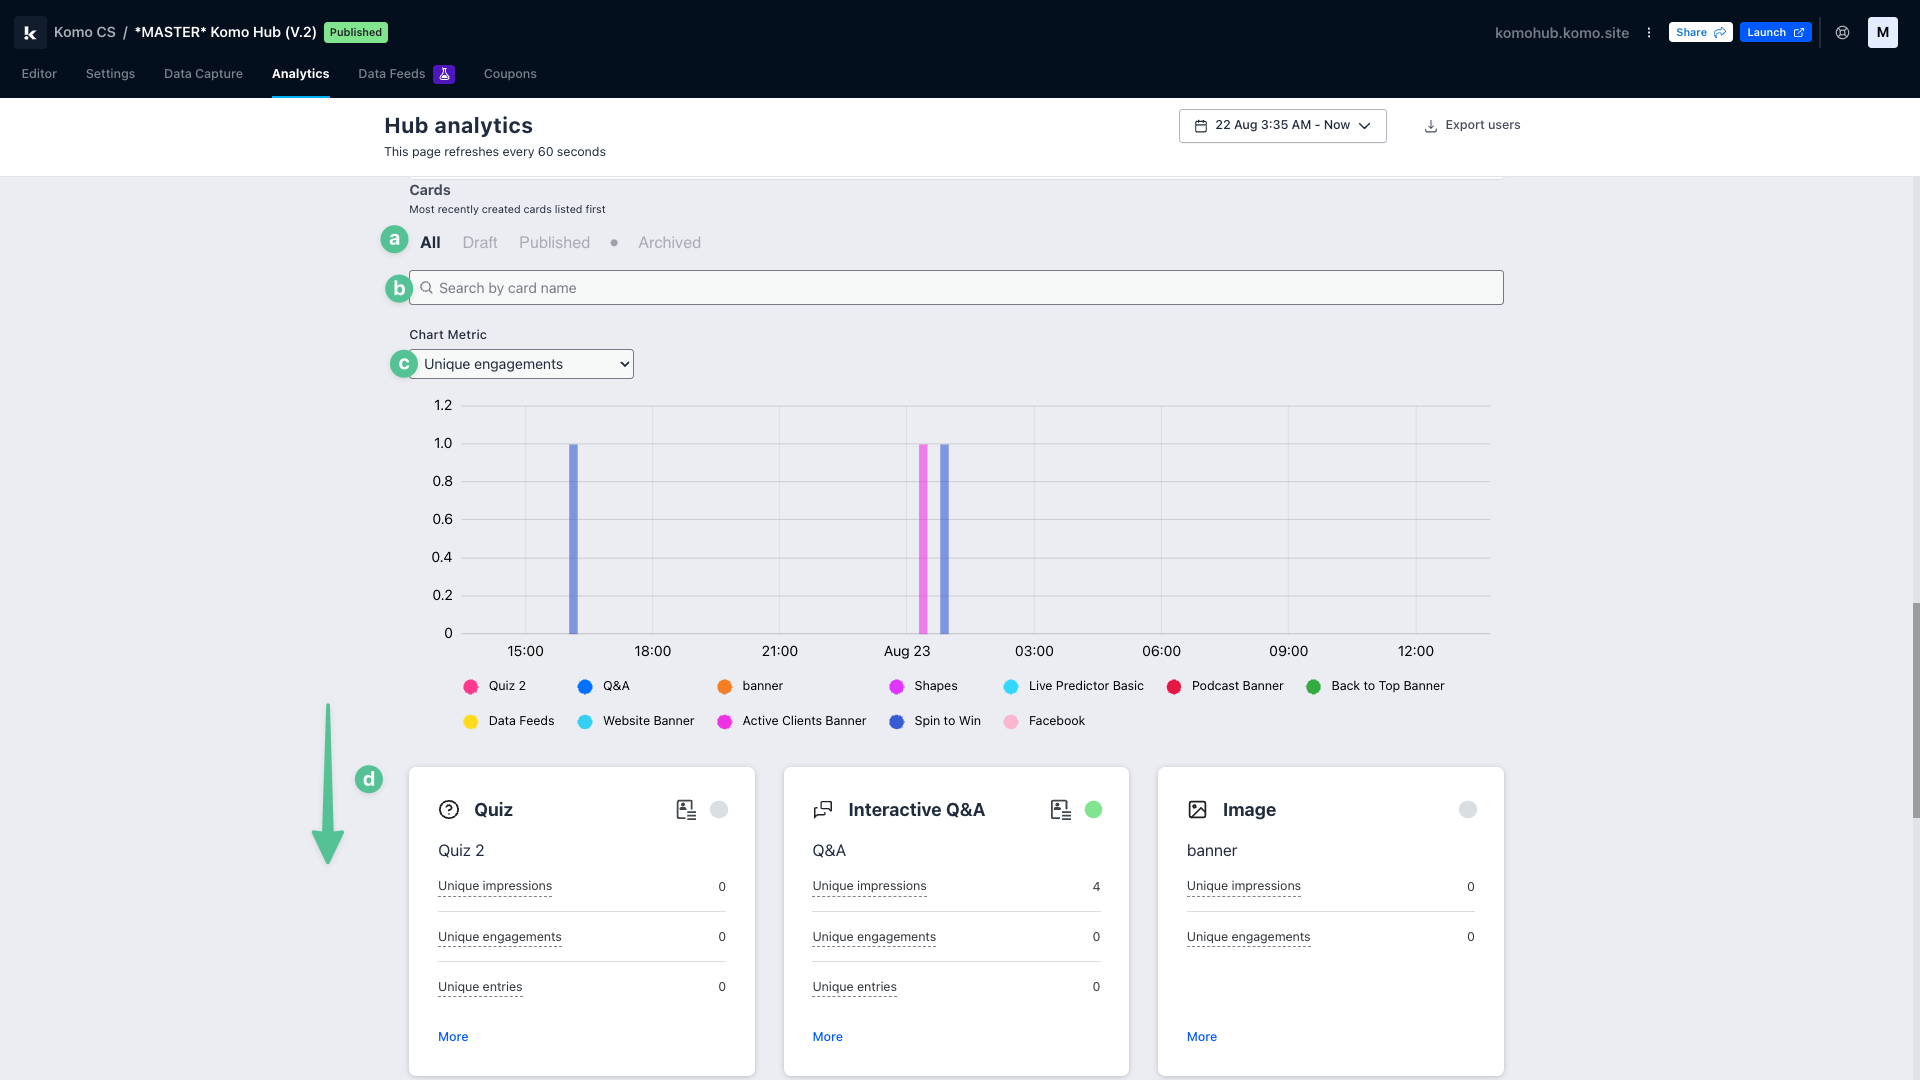
- Within Hub-level analytics, you also have a high-level overview of each Card side-by-side. This a great way to determine which mechanics are working best for your Hub.
- (a) Here you can filter your Cards by their status, i.e. All, draft, published or achieved.
- (b) Here you can search for particular Cards.
- (c) Here you can set the metric for the bar chart below, which shows the performance of your Cards side-by-side.
- (d) Here you can see a high-level overview of the statistics most relevant to each mechanic you have on your Hub. Clicking on each statistic will open the analytics for that particular Card for the date range you set in Step 1.
Accessing Card-Level Analytics:
Navigate to your chosen Card
- From your company homepage, navigate to your Engagement Hub, find your chosen Card and open the editor.
- From here, click on the analytics tab in the left navigation.
Note: We've used our Knowledge Base Hub as an example here! This Hub is only used internally.
Term definitions & navigation
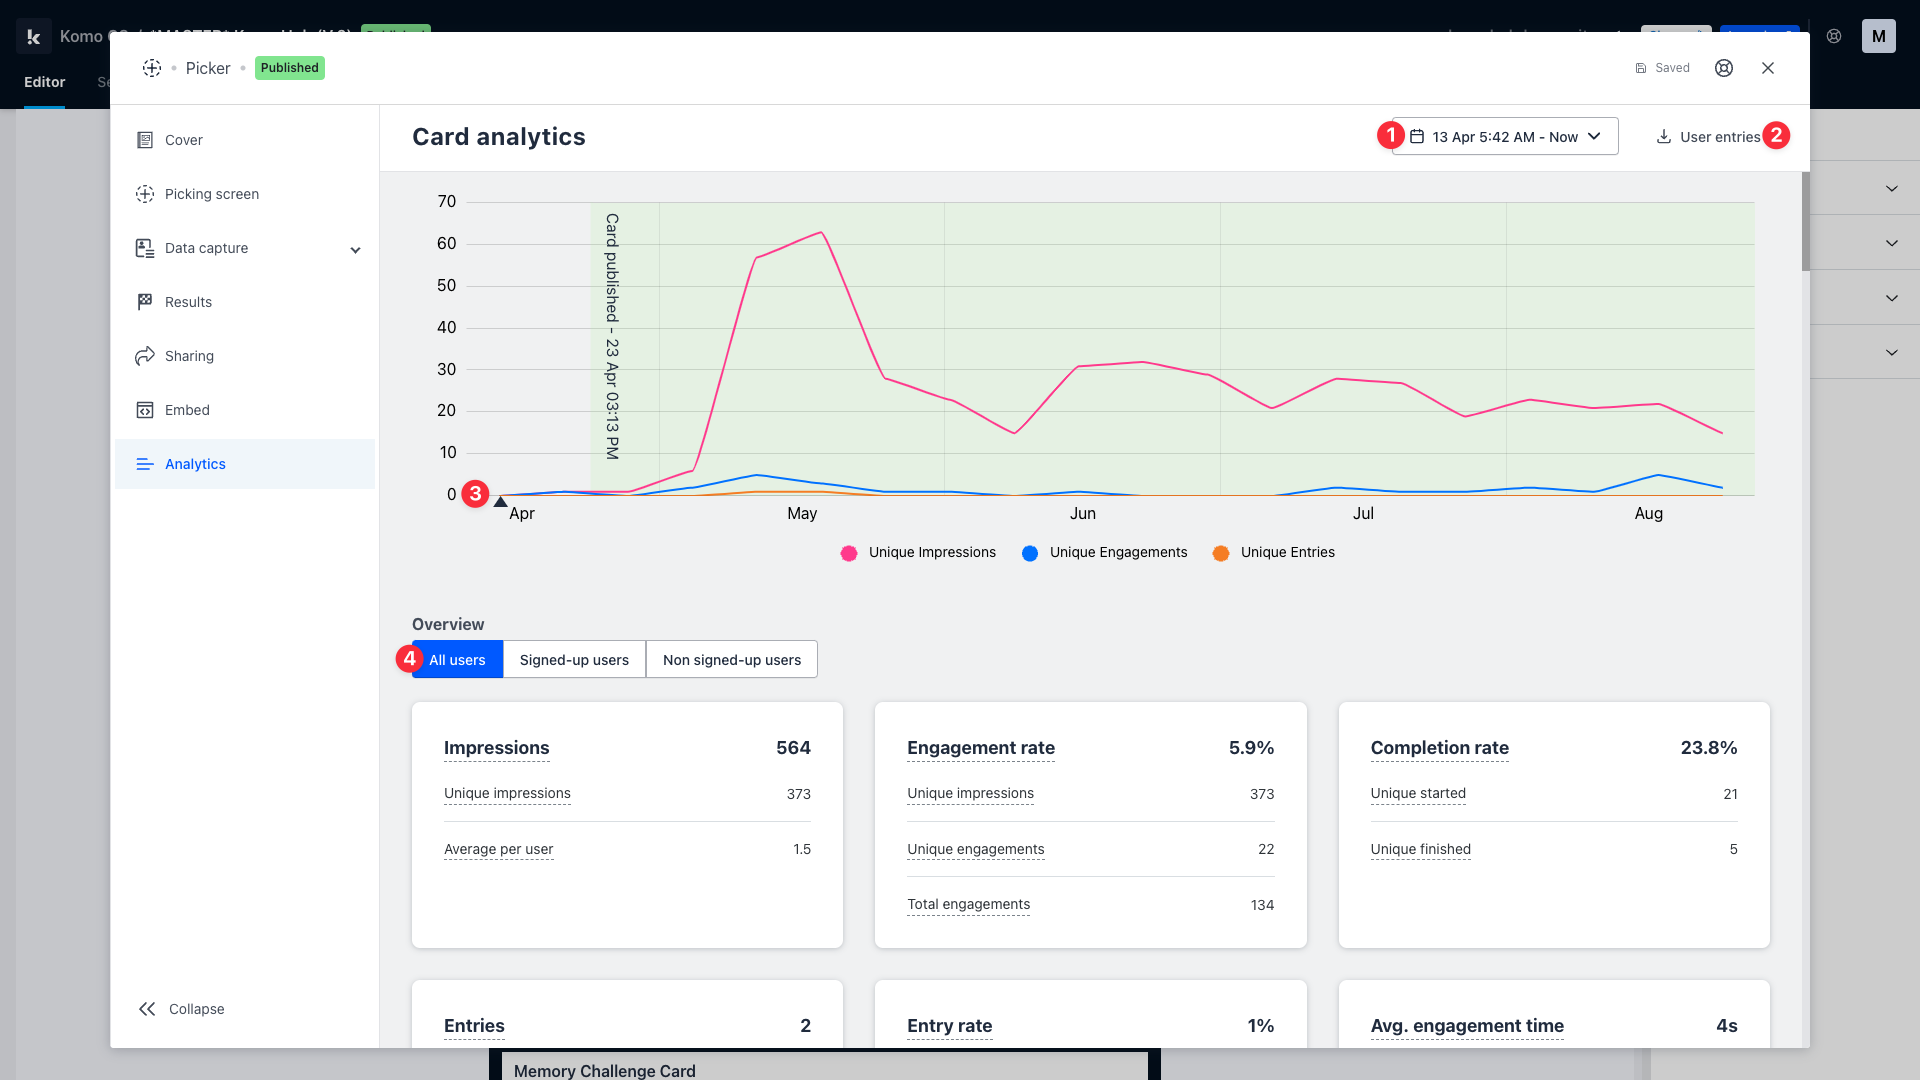
- Let's go over the key navigation of this modal first up!
- (1) Here you can set the date and time range you wish to apply to your analytics.
- (2) Here you can download a .CSV file of your Hub's users.
- (3) This line graph shows the number of unique impressions, engagements and entries across your Hub along the timeline you set in Step 1.
- (4) Here, you can choose to filter your analytics by all users, signed-up users or non-signed-up users.
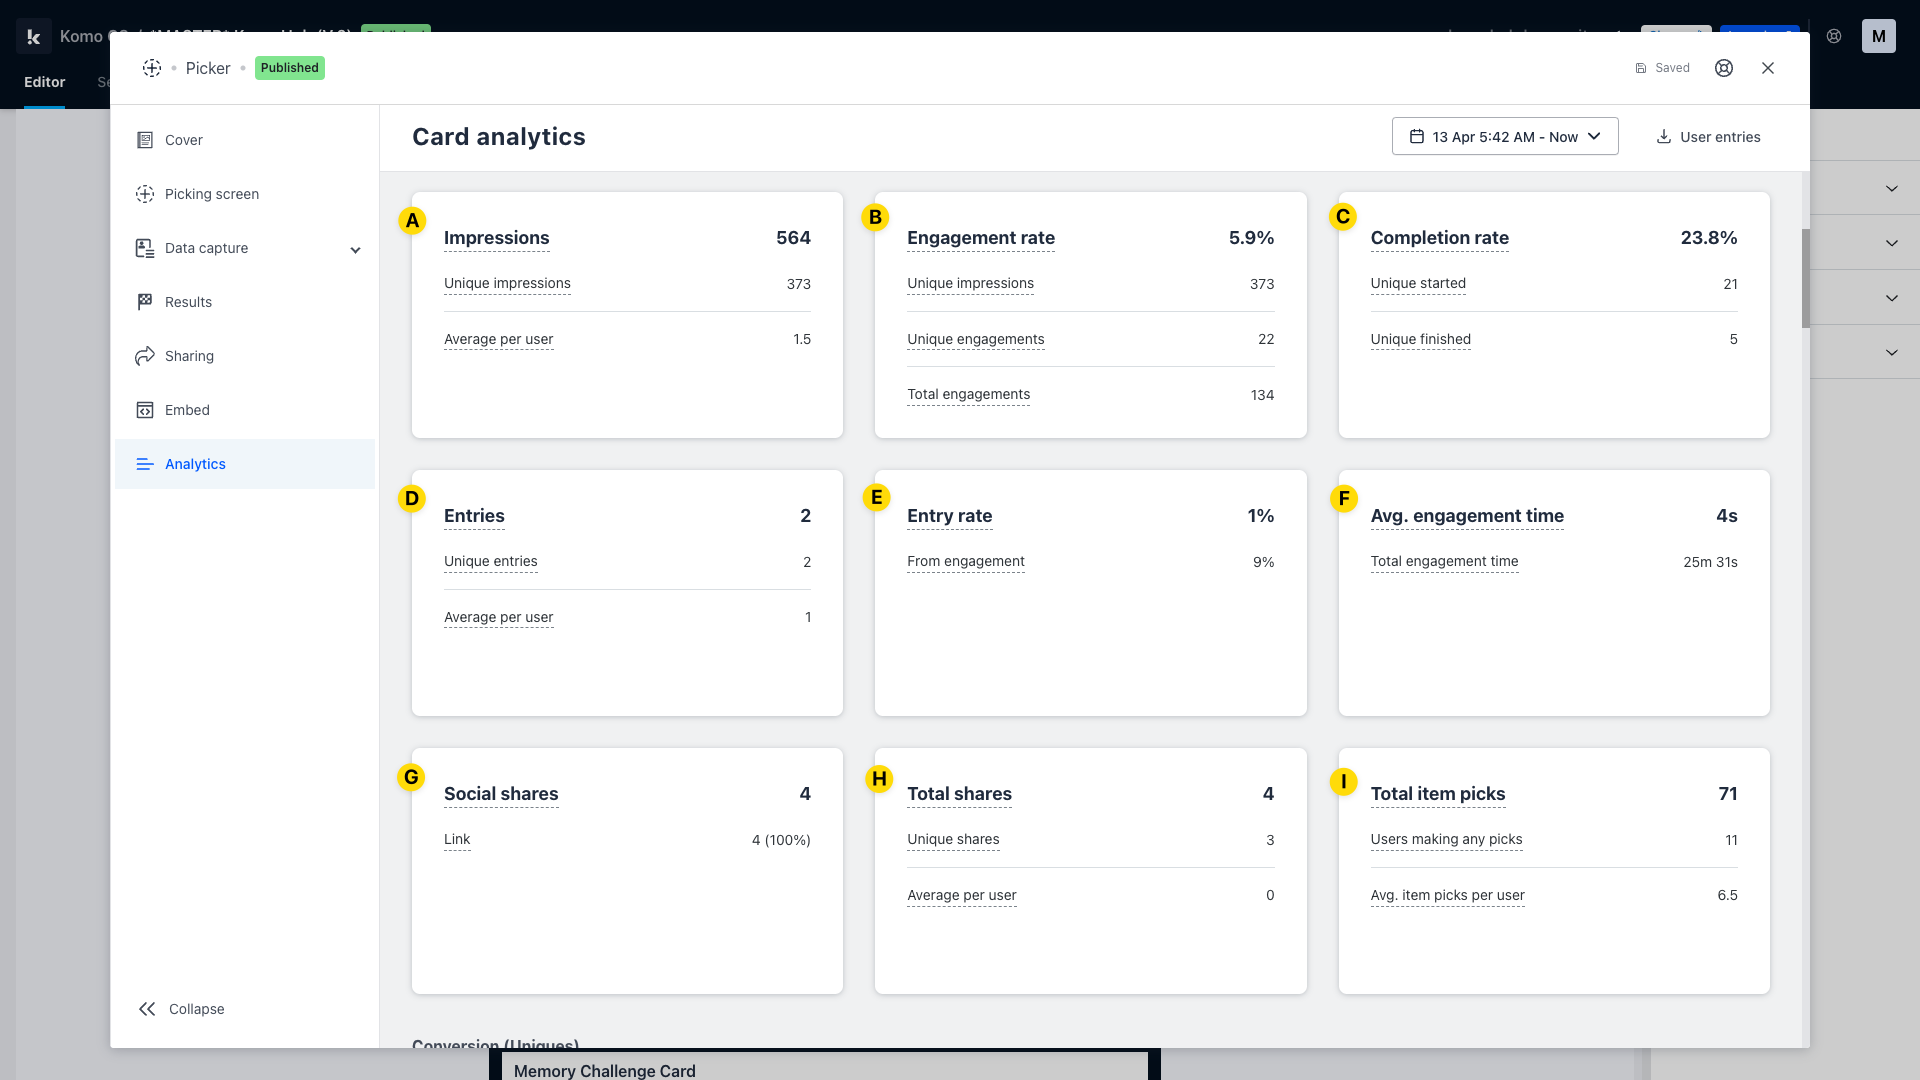
- As you scroll down, you will begin to see your Hub's key live statistics, in line with the filtering you may have set above. Note that hovering over a term will provide you with its definition! But we'll define them for you here too.
- (A) Impressions: The total number of times your Hub URL has been loaded.
- (B) Engagement Rate: The number of times that users engaged with your content as a percentage of impressions. Unique engagements / unique impressions.
- (C) Completion Rate: The number of times that users completed this Card as a percentage of the number of users that started this Card. Unique finished / unique started.
- (D) Entries: The total number of data capture entries.
- (E) Entry Rate: The number of unique entries as a percentage of impressions. Unique entries / unique impressions.
- (F) Average Engagement Time: The average amount of time each user spent engaged with this Card. Total engagement time / unique impressions.
- (G) + (H) Social Shares and Total Shares: Here you will see the number of times your Card has been shared, and the total and unique sharing statistics. Please note that these analytics will only appear if you have sharing toggled on for your Card.
- (I) Note that often you will find analytics specific to a certain mechanic in card-level analytics. For example, here we can see the Total Item Picks, which is the total number of individual items picked on our Picker Card.
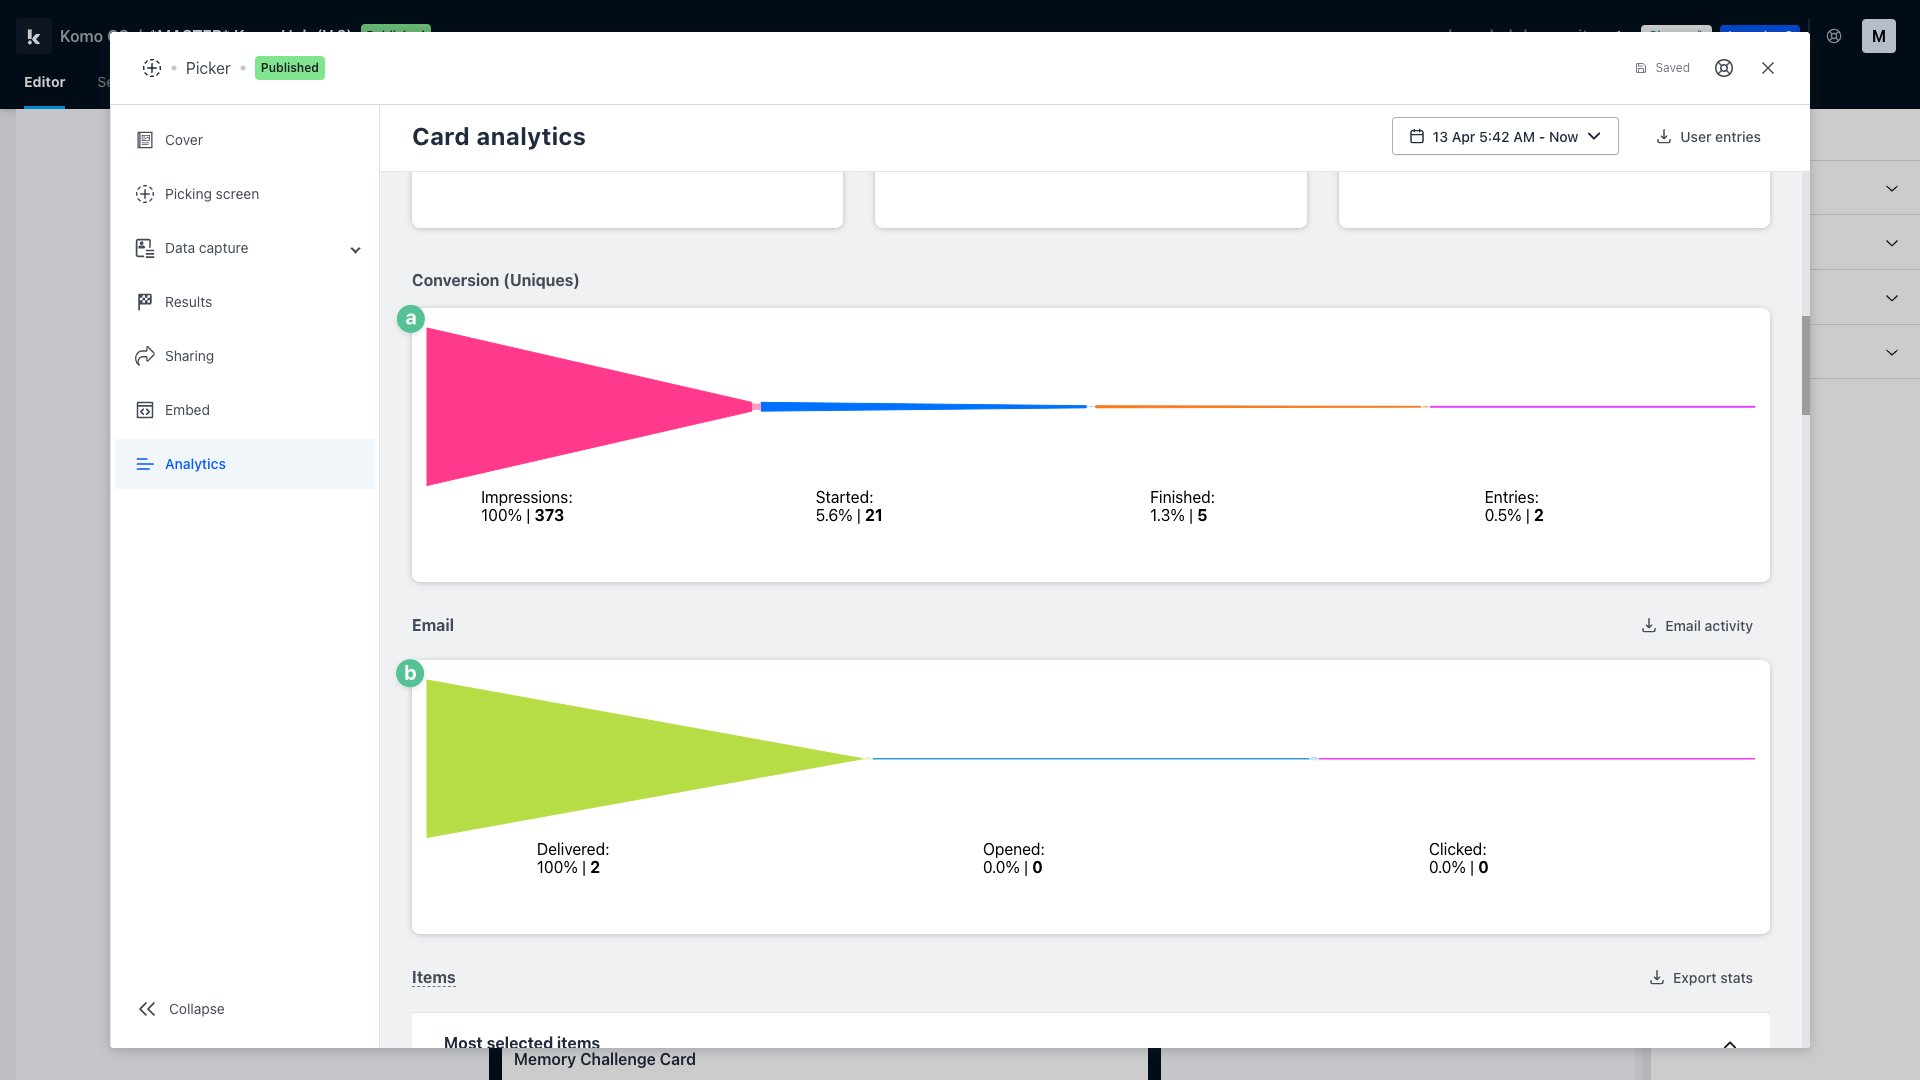
- With Card-level analytics, you also have this siloed funnel view of some key Card metrics.
- (a) In the conversions funnel, you can see which impressions started the Card, which of those users finished the Card, and of those, who entered the attached competition by filling in a data capture form.
- (b) In the email funnel, you can see the number of emails delivered, the percentage of delivered emails that were opened, and the percentage of opened emails that were engaged with (clicked, which refers to any links or buttons you may have on your emails).
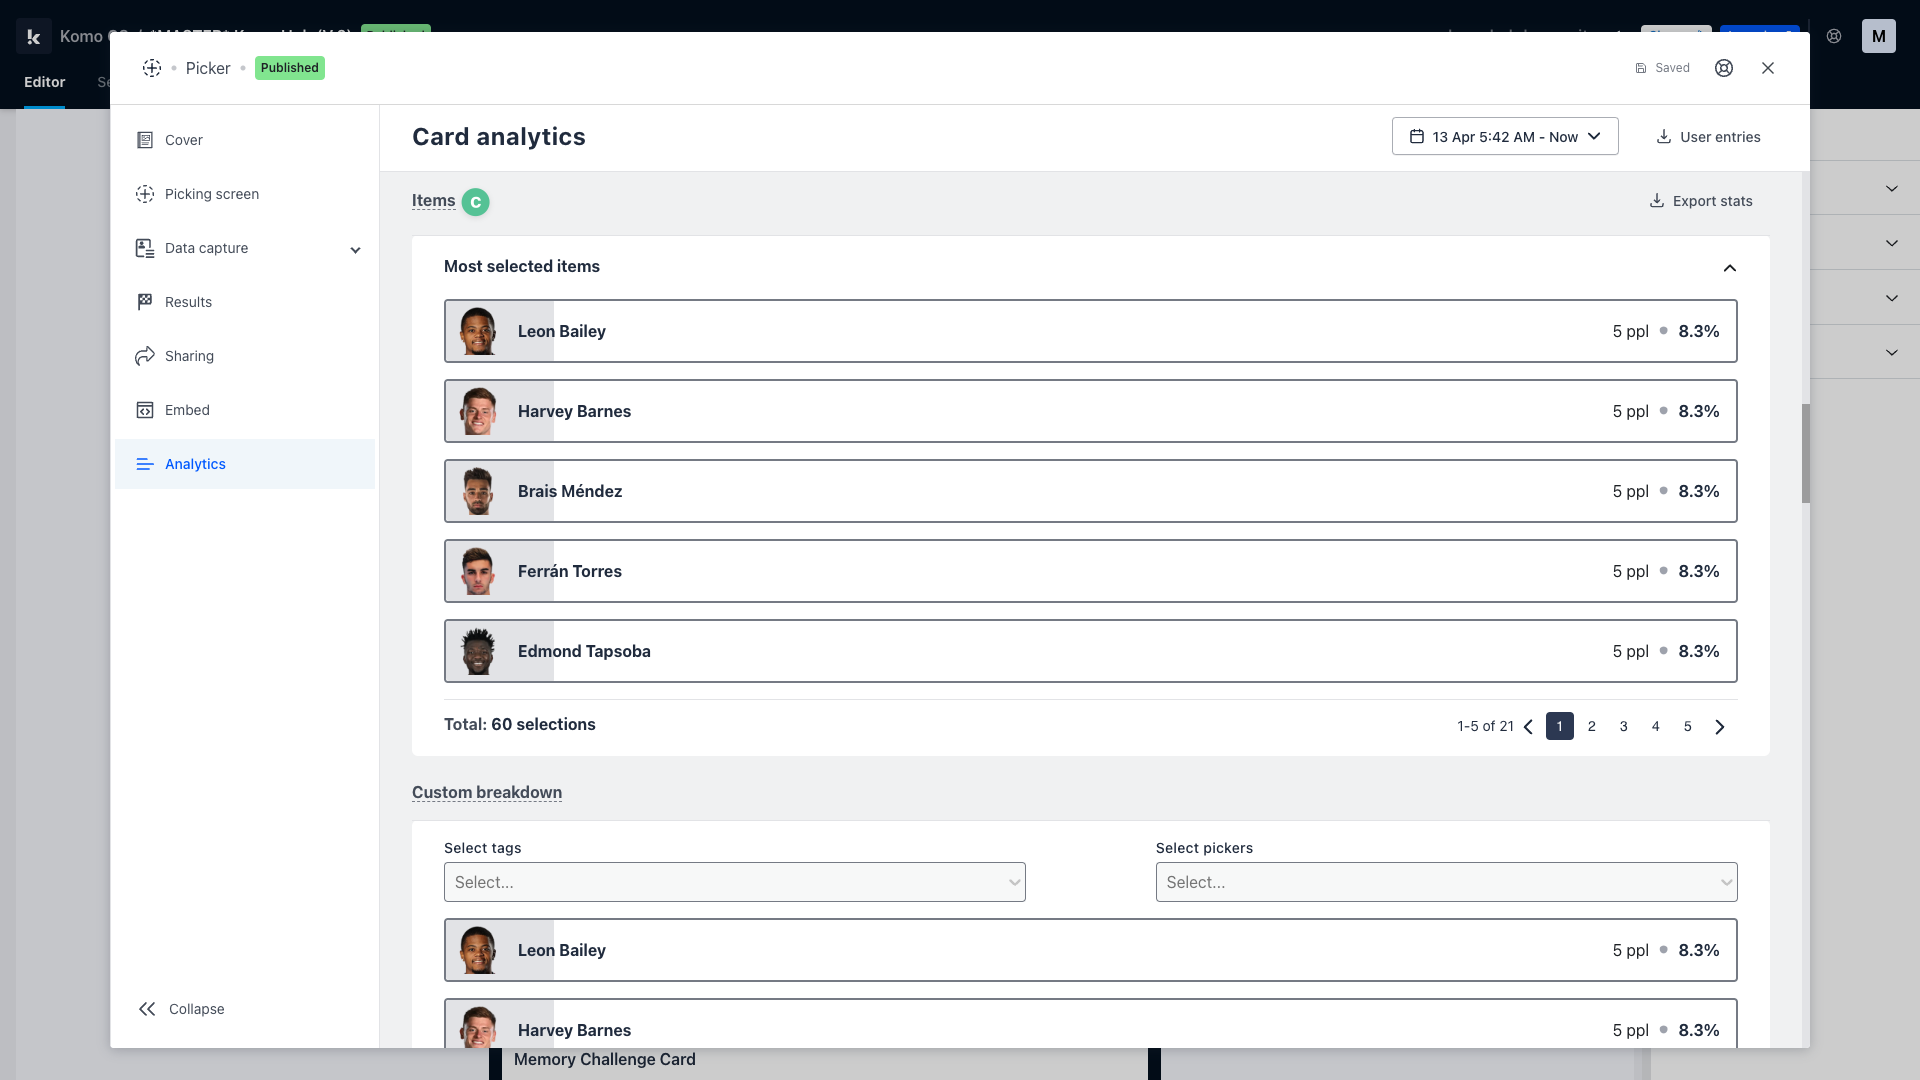
- With Card-level analytics, you will also find various Card-specific analytics, which will change depending on the Card you have chosen to use.
- (c) Because this Card is a Picker, we can see some statistics on the most selected items, etc.
FAQ
Why do my analytics look different for each different Card I use?
Our collection of content pieces are all vastly different, to allow you to create interactive, immersive campaigns that are engaging in different ways! For this reason, it's only fitting that different mechanics should have different analytics to assist you as you test and learn different Cards on the Platform. For example, item picks (made for the Picker Card) are not going to be relevant statistics for a Live Trivia Card.
One last note:
At Komo, we pride ourselves on not only the results our clients achieve with us but the service they receive whilst bringing their hubs to life.
If you ever have any questions about an upcoming activation, how you can best utilize Komo to get the best possible outcome or just a general query, please don't hesitate to reach out to your Customer Success Specialist or email us at support@komo.tech
We also love your feedback, so please let us know if this article helped you by selecting from the options below.
Louis Docherty
Head of Customer Success