
What is it?
Our Analytics modal is designed to empower our customers with valuable insights into the performance of their Komo Engagement Engine campaigns. With a focus on user engagement, conversion rates, and detailed performance metrics, you can make data-driven decisions to optimize your campaigns.How do I use it?
Accessing Hub-Level Analytics: Accessing Card-Level Analytics:Accessing Hub-Level Analytics
Navigate to Hub-Level Analytics
We’ve used our Knowledge Base Hub as an example here! This Hub is only used internally.
Hub term definitions & navigation
Let’s go over the key navigation of this modal first up!- (1) Here you can set the date and time range you wish to apply to your analytics
- (2) Here you can download a .CSV file of your Hub’s users
- (3) This line graph shows the number of unique impressions, engagements and entries across your Hub along the timeline you set in Step 1
- (4) Here, you can choose to filter your analytics by all users, signed-up users or non-signed-up users
These options will only appear if you have User Accounts Enabled. This feature is available for Growth subscriptions and above.
Hub Analytics
Hub Analytics
-
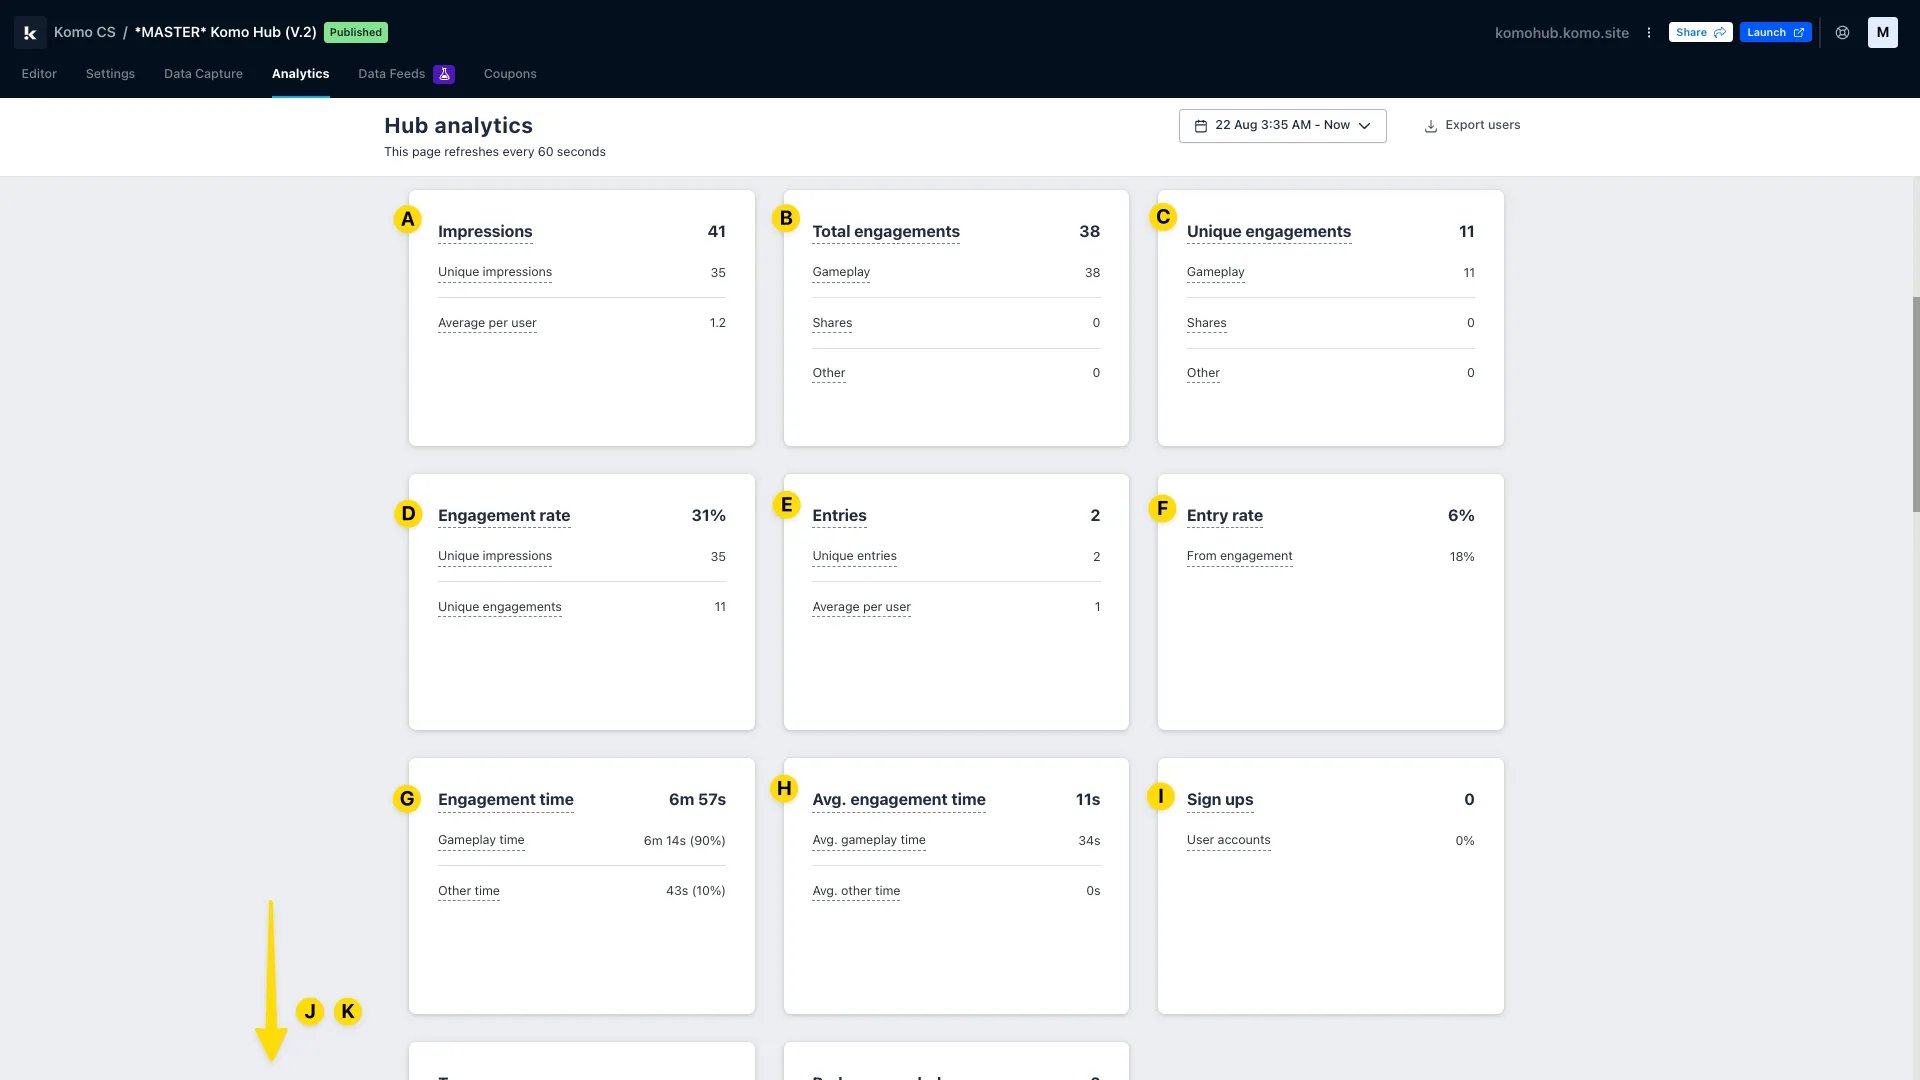
As you scroll down, you will begin to see your Hub’s key live statistics, in line with the filtering you may have set above. Note that hovering over a term will provide you with its definition! (But we’ll define them for you here too.)
- (A) Impressions: The total number of times your Hub URL has been loaded
- (B) Total Engagements: The total number of times your users have engaged with your content. This tracks every click on your Hub, including gameplay clicks, like items picks on the Picker Card!
- (C) Unique Engagements: The number of unique users that have engaged with your content
In the context of analytics, the word ‘unique’ is used to describe a singular user who takes an action on your Hub in a given period (i.e. the time period you have set in Step 1). This is to say that if that same user completed that same action in the same 24-hour period, this would not be a ‘unique’ metric.
- (D) Engagement Rate: The number of times that users engaged with your content as a percentage of impressions. Unique engagements / unique impressions.
- (E) Entries: The total number of data capture entries
- (F) Entry Rate: The number of unique entries as a percentage of impressions. Unique entries / unique impressions.
- (G) Engagement Time: The total amount of time users spent engaged with all content across your Hub
- (H) Average Engagement Time: The average amount of time each user spent engaged with any content on your Hub. Total engagement time / unique impressions.
- (I) Sign-Ups: The total number of user accounts created during the reporting period
- (J) Top Sources: Where your Hub impressions come from. This stat uses referrer, UTM source and UTM medium parameters to determine sources
- (K) Badges Awarded: Where you can view the number of Badges awarded across your Hub, separated into individual Badges within Badge Variants. Please note that this will only appear if you are using Badges on your Hub
-
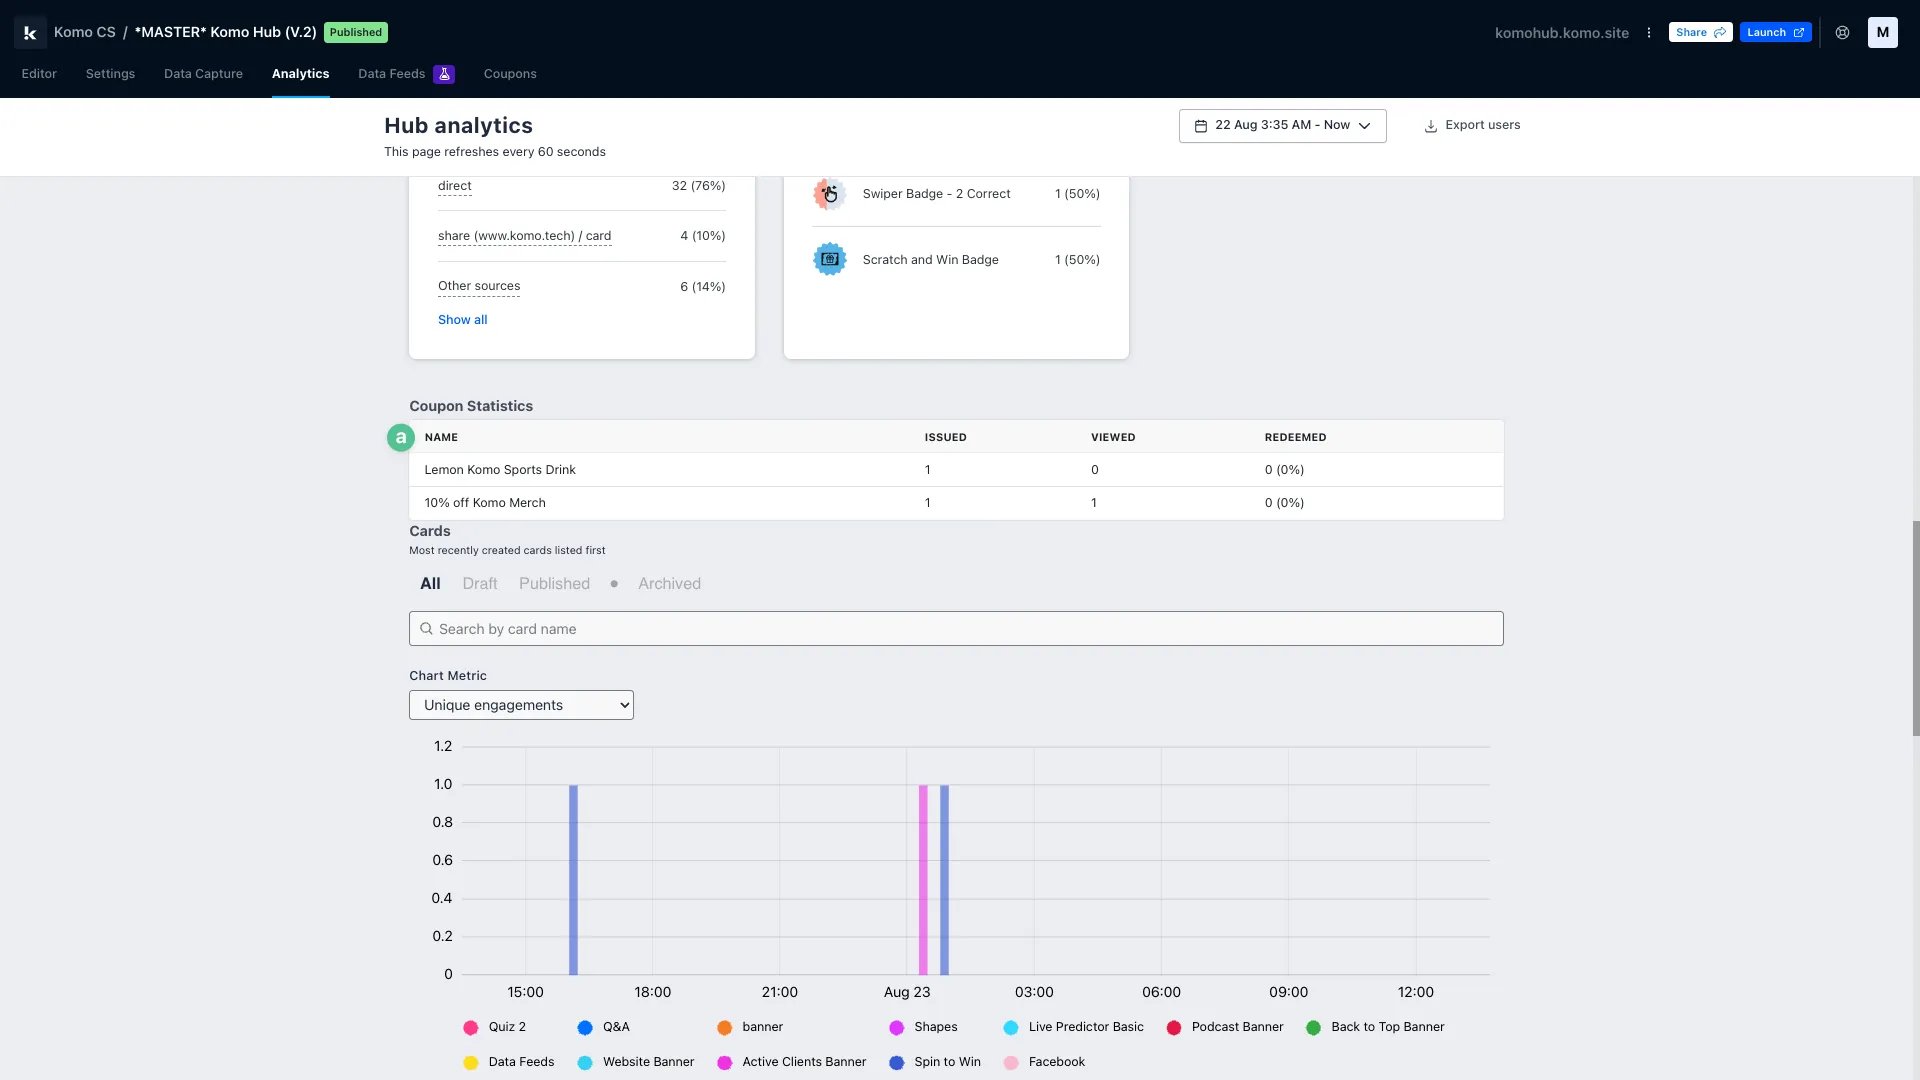
(a) Coupons Statistics: If you are using Digital Coupons on your Hub, here you will see a breakdown of the Coupons issued, viewed and redeemed across your Cards\
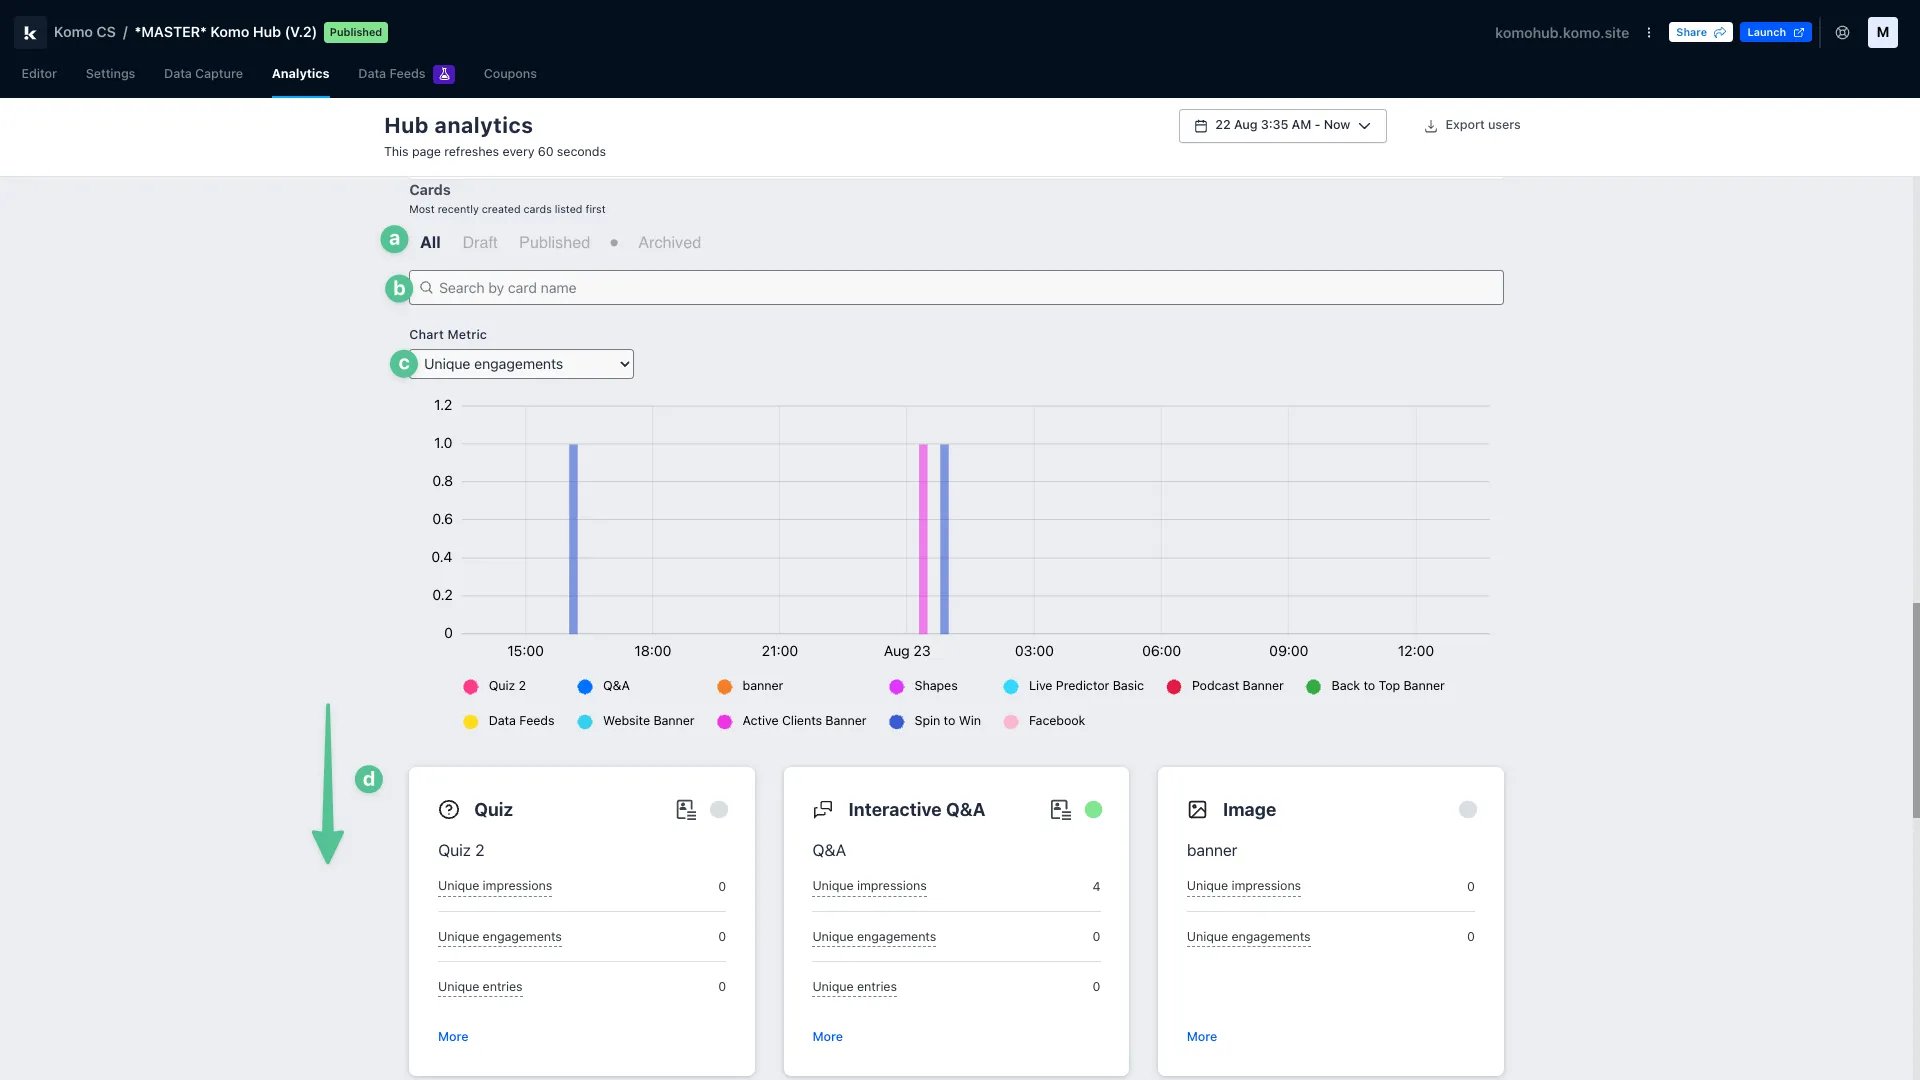
- (a) Here you can filter your Cards by their status, i.e. All, draft, published or archived
- (b) Here you can search for particular Cards
- (c) Here you can set the metric for the bar chart below, which shows the performance of your Cards side-by-side
- (d) Here you can see a high-level overview of the statistics most relevant to each mechanic you have on your Hub. Clicking on each statistic will open the analytics for that particular Card for the date range you set in Step 1.
Accessing Card-Level Analytics
Navigate to your chosen Card
- From your company homepage, navigate to your Engagement Hub, find your chosen Card and open the editor
- From here, click on the analytics tab in the left navigation
We’ve used our Knowledge Base Hub as an example here! This Hub is only used internally.
Card term definitions & navigation
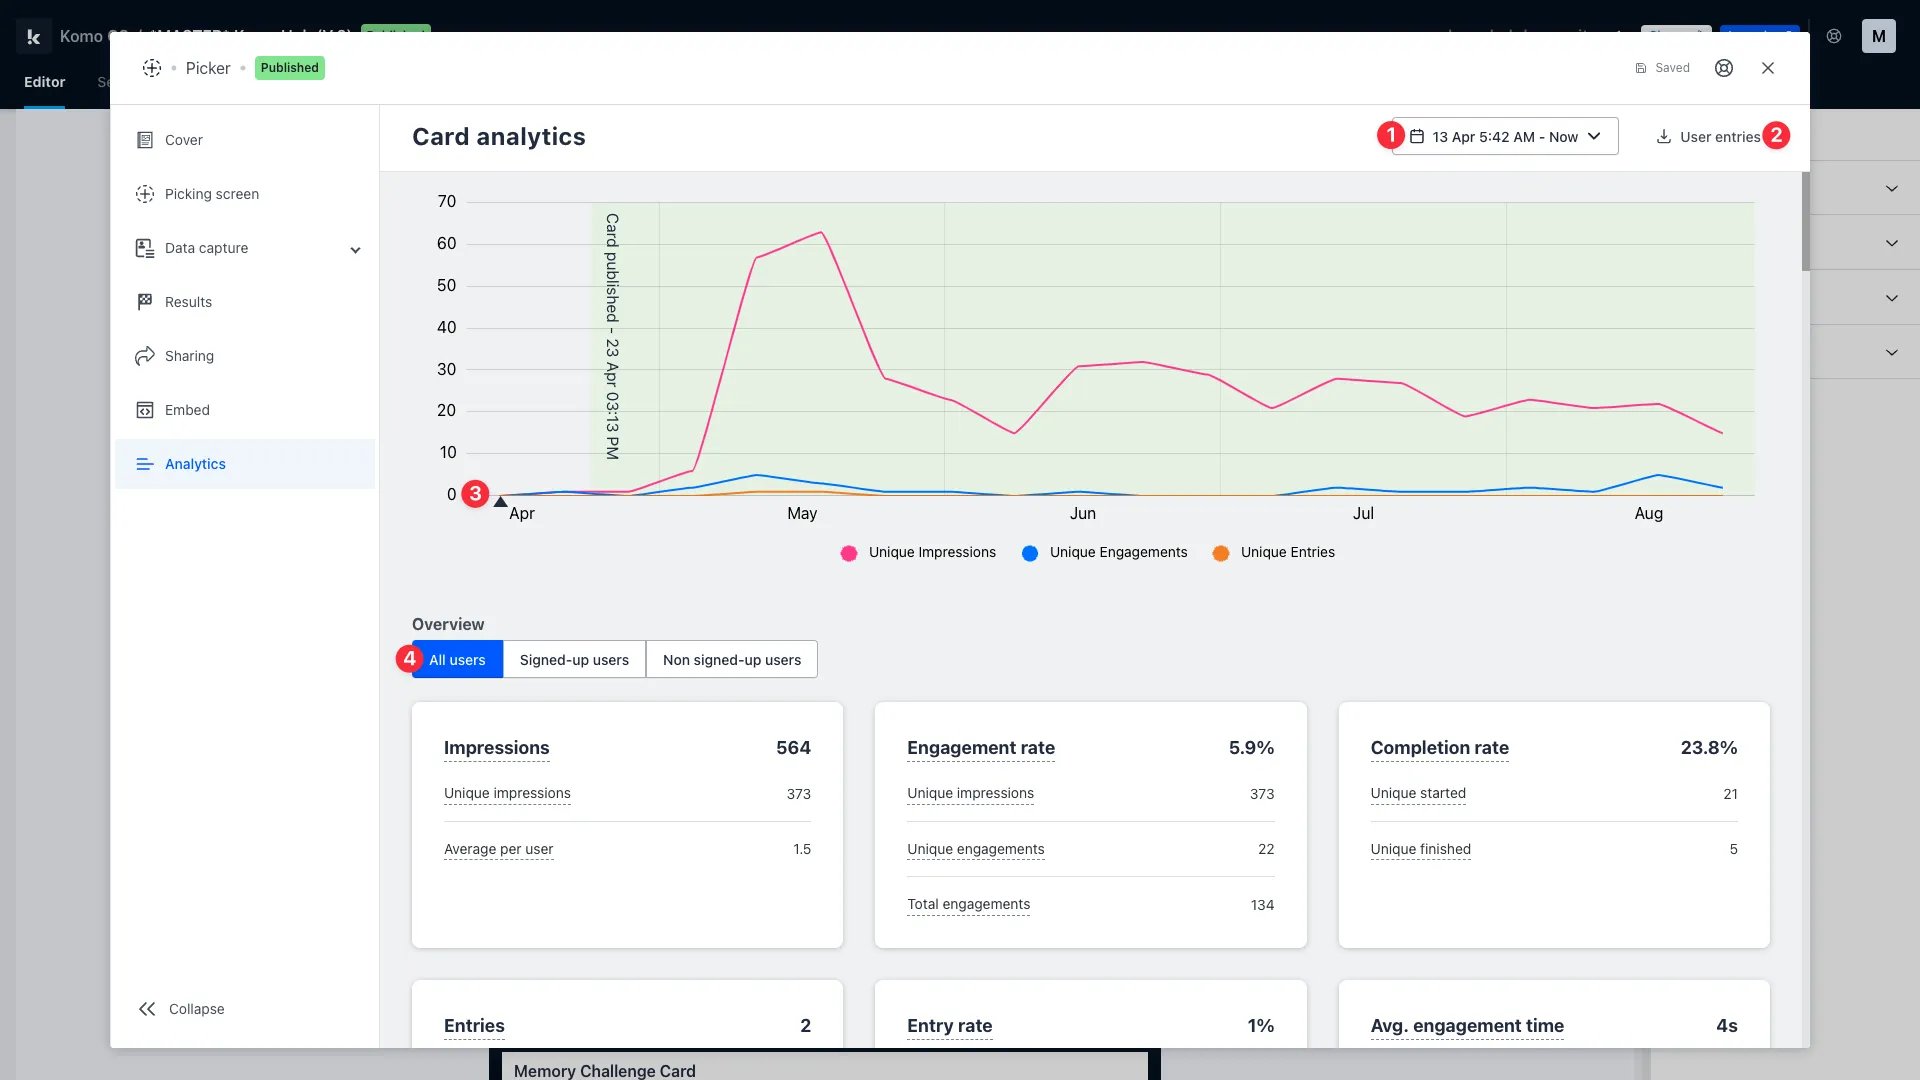
- (1) Here you can set the date and time range you wish to apply to your analytics
- (2) Here you can download a .CSV file of your Hub’s users
- (3) This line graph shows the number of unique impressions, engagements and entries across your Hub along the timeline you set in Step 1
- (4) Here, you can choose to filter your analytics by all users, signed-up users or non-signed-up users
Card Analytics
Card Analytics
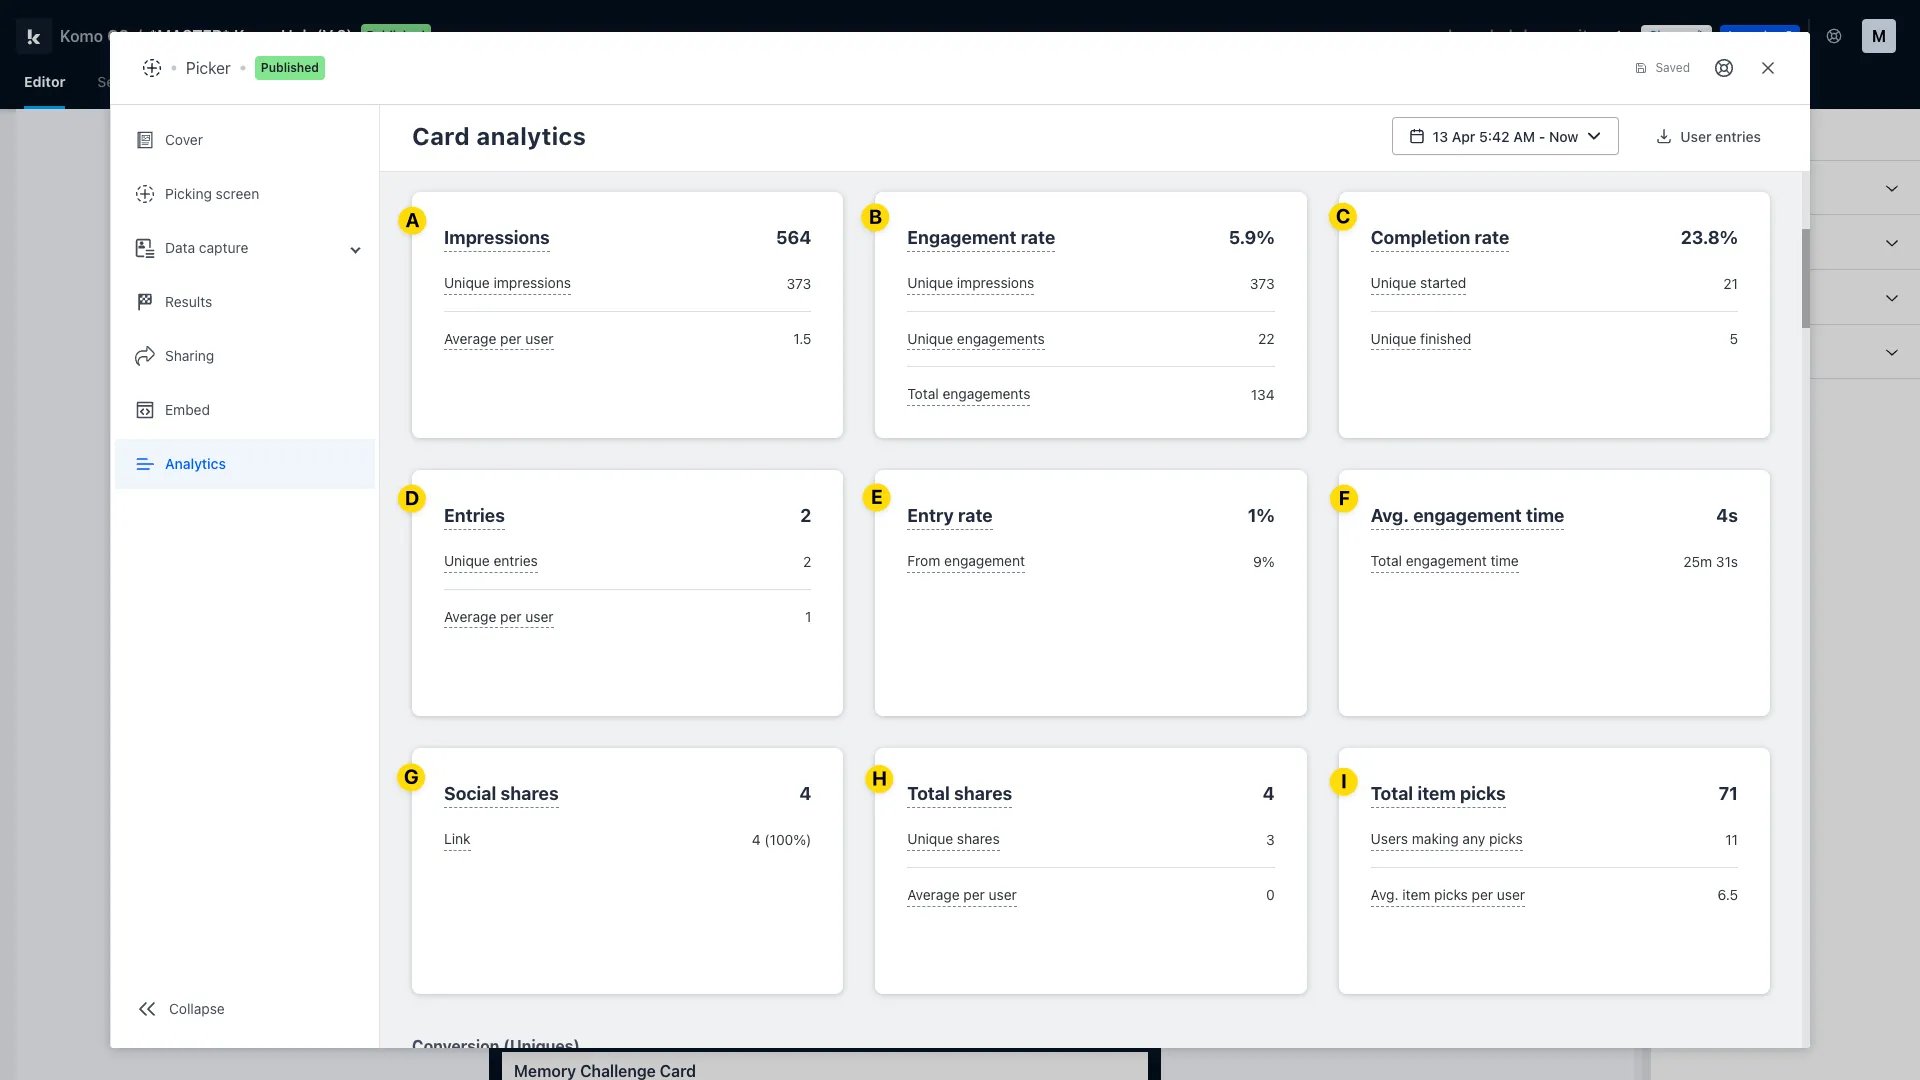
- (A) Impressions: The total number of times your Hub URL has been loaded
- (B) Engagement Rate: The number of times that users engaged with your content as a percentage of impressions. Unique engagements / unique impressions.
- (C) Completion Rate: The number of times that users completed this Card as a percentage of the number of users that started this Card. Unique finished / unique started.
- (D) Entries: The total number of data capture entries
- (E) Entry Rate: The number of unique entries as a percentage of impressions. Unique entries / unique impressions.
- (F) Average Engagement Time: The average amount of time each user spent engaged with this Card. Total engagement time / unique impressions.
- (G) + (H) Social Shares and Total Shares: Here you will see the number of times your Card has been shared, and the total and unique sharing statistics. Please note that these analytics will only appear if you have sharing toggled on for your Card
-
(I) Note that often you will find analytics specific to a certain mechanic in card-level analytics. For example, here we can see the Total Item Picks, which is the total number of individual items picked on our Picker Card
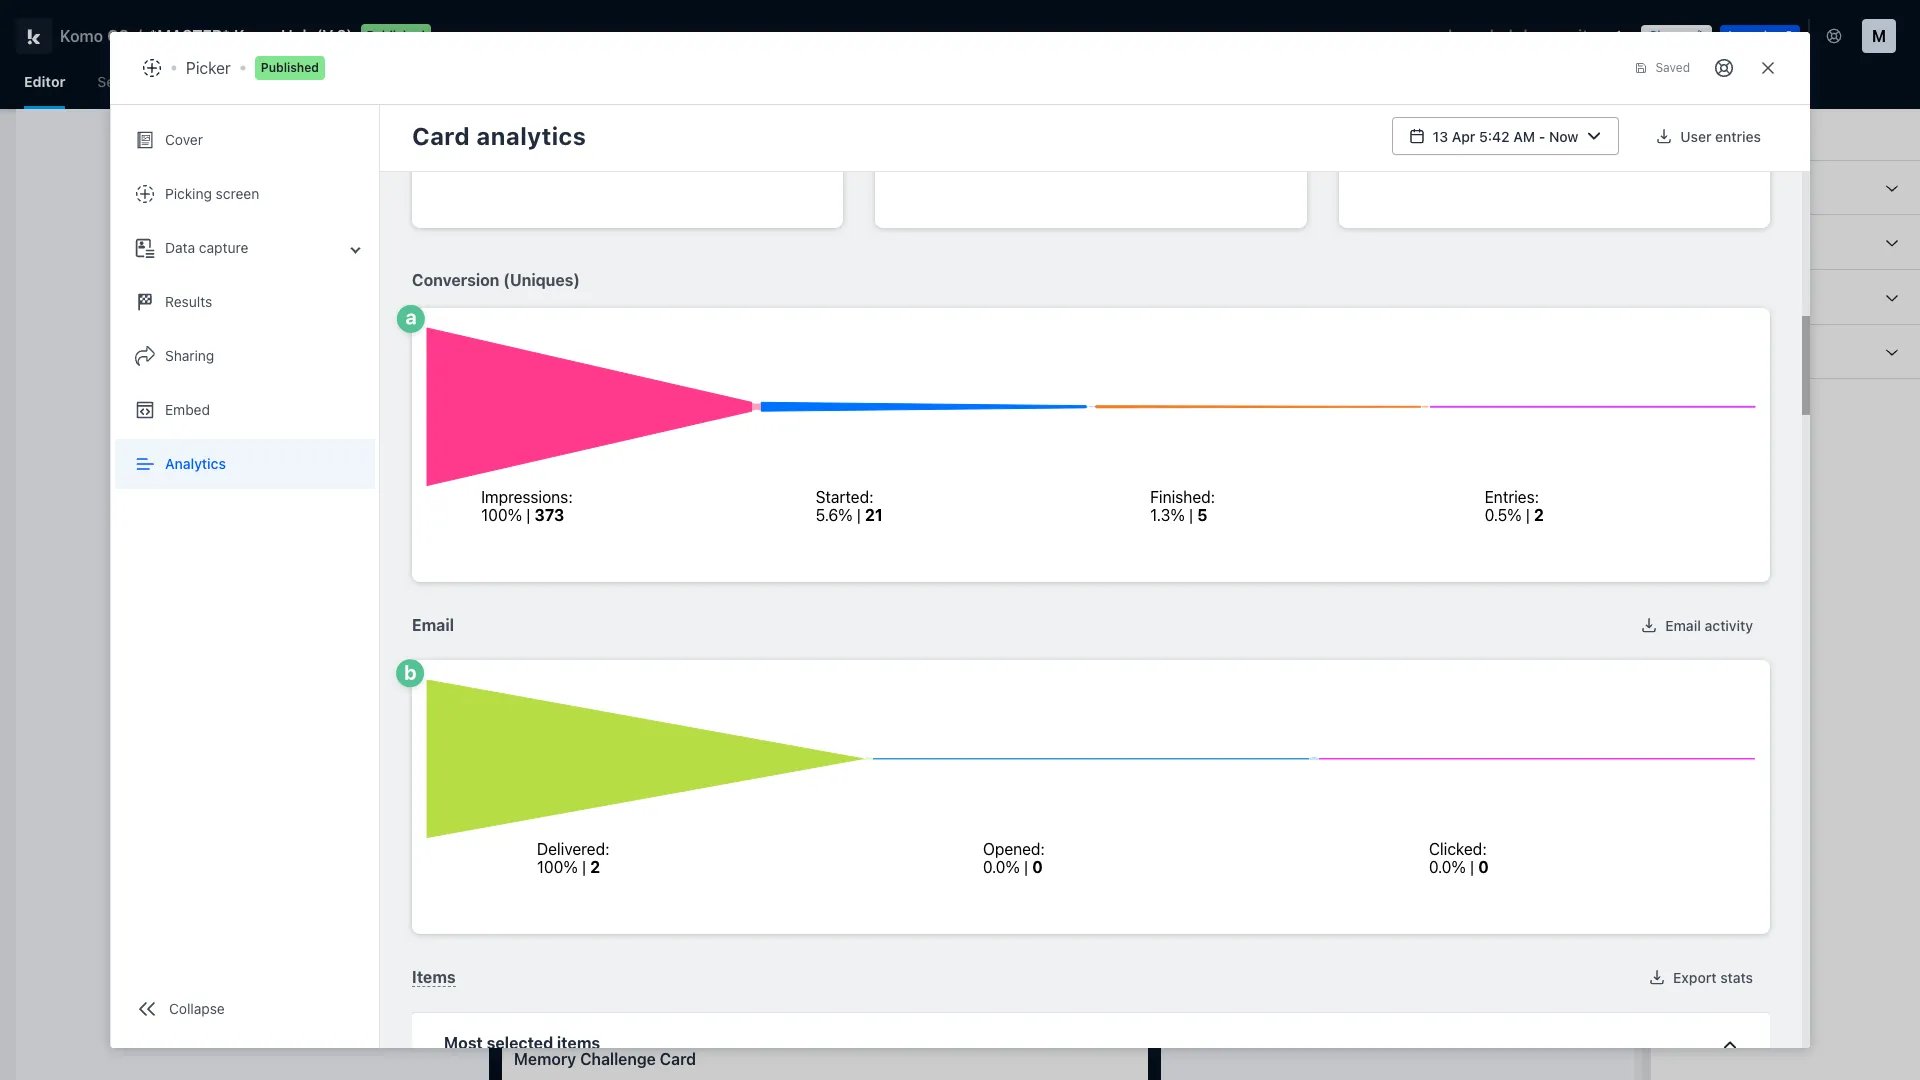
- (a) In the conversions funnel, you can see which impressions started the Card, which of those users finished the Card, and of those, who entered the attached competition by filling in a data capture form
- (b) In the email funnel, you can see the number of emails delivered, the percentage of delivered emails that were opened, and the percentage of opened emails that were engaged with (clicked, which refers to any links or buttons you may have on your emails)
The email funnel will only appear if you have attached communications to your Card and actioned these.
- (c) Because this Card is a Picker, we can see some statistics on the most selected items, etc.