
What is it?
Our Live Data Feeds are a solution we’ve engineered to allow you to display card data and promotional content from your Hub on the big screen during live events! These can be used in a variety of environments, from sports games, conferences, panels and even virtual events [read more about use cases here. With Live Data Feeds, you can completely customise big-screen displays to reflect your brand and share your Hub at scale. Add text, QR codes, the results from your cards, and more to create an immersive experience that helps your audience feel a part of the action!Common Use Cases
We thought we’d share a few examples of how our Live Data Feeds are used by our customers - Just to get the ideas flowing!B&T Awards Live Trivia Leaderboard Data Feed
Sydney FC Man of the Match Predictor Data Feed
Komo Joyalty event promotional Data Feed
How do I build one?
Preparing your Live Data Feed/s
Step 1: Add a Live Data Feed to your Hub
Note: If you are creating a Data Feed where you want to pull data from a particular card, you will need to ensure you have set up the card prior to creating your Data Feed.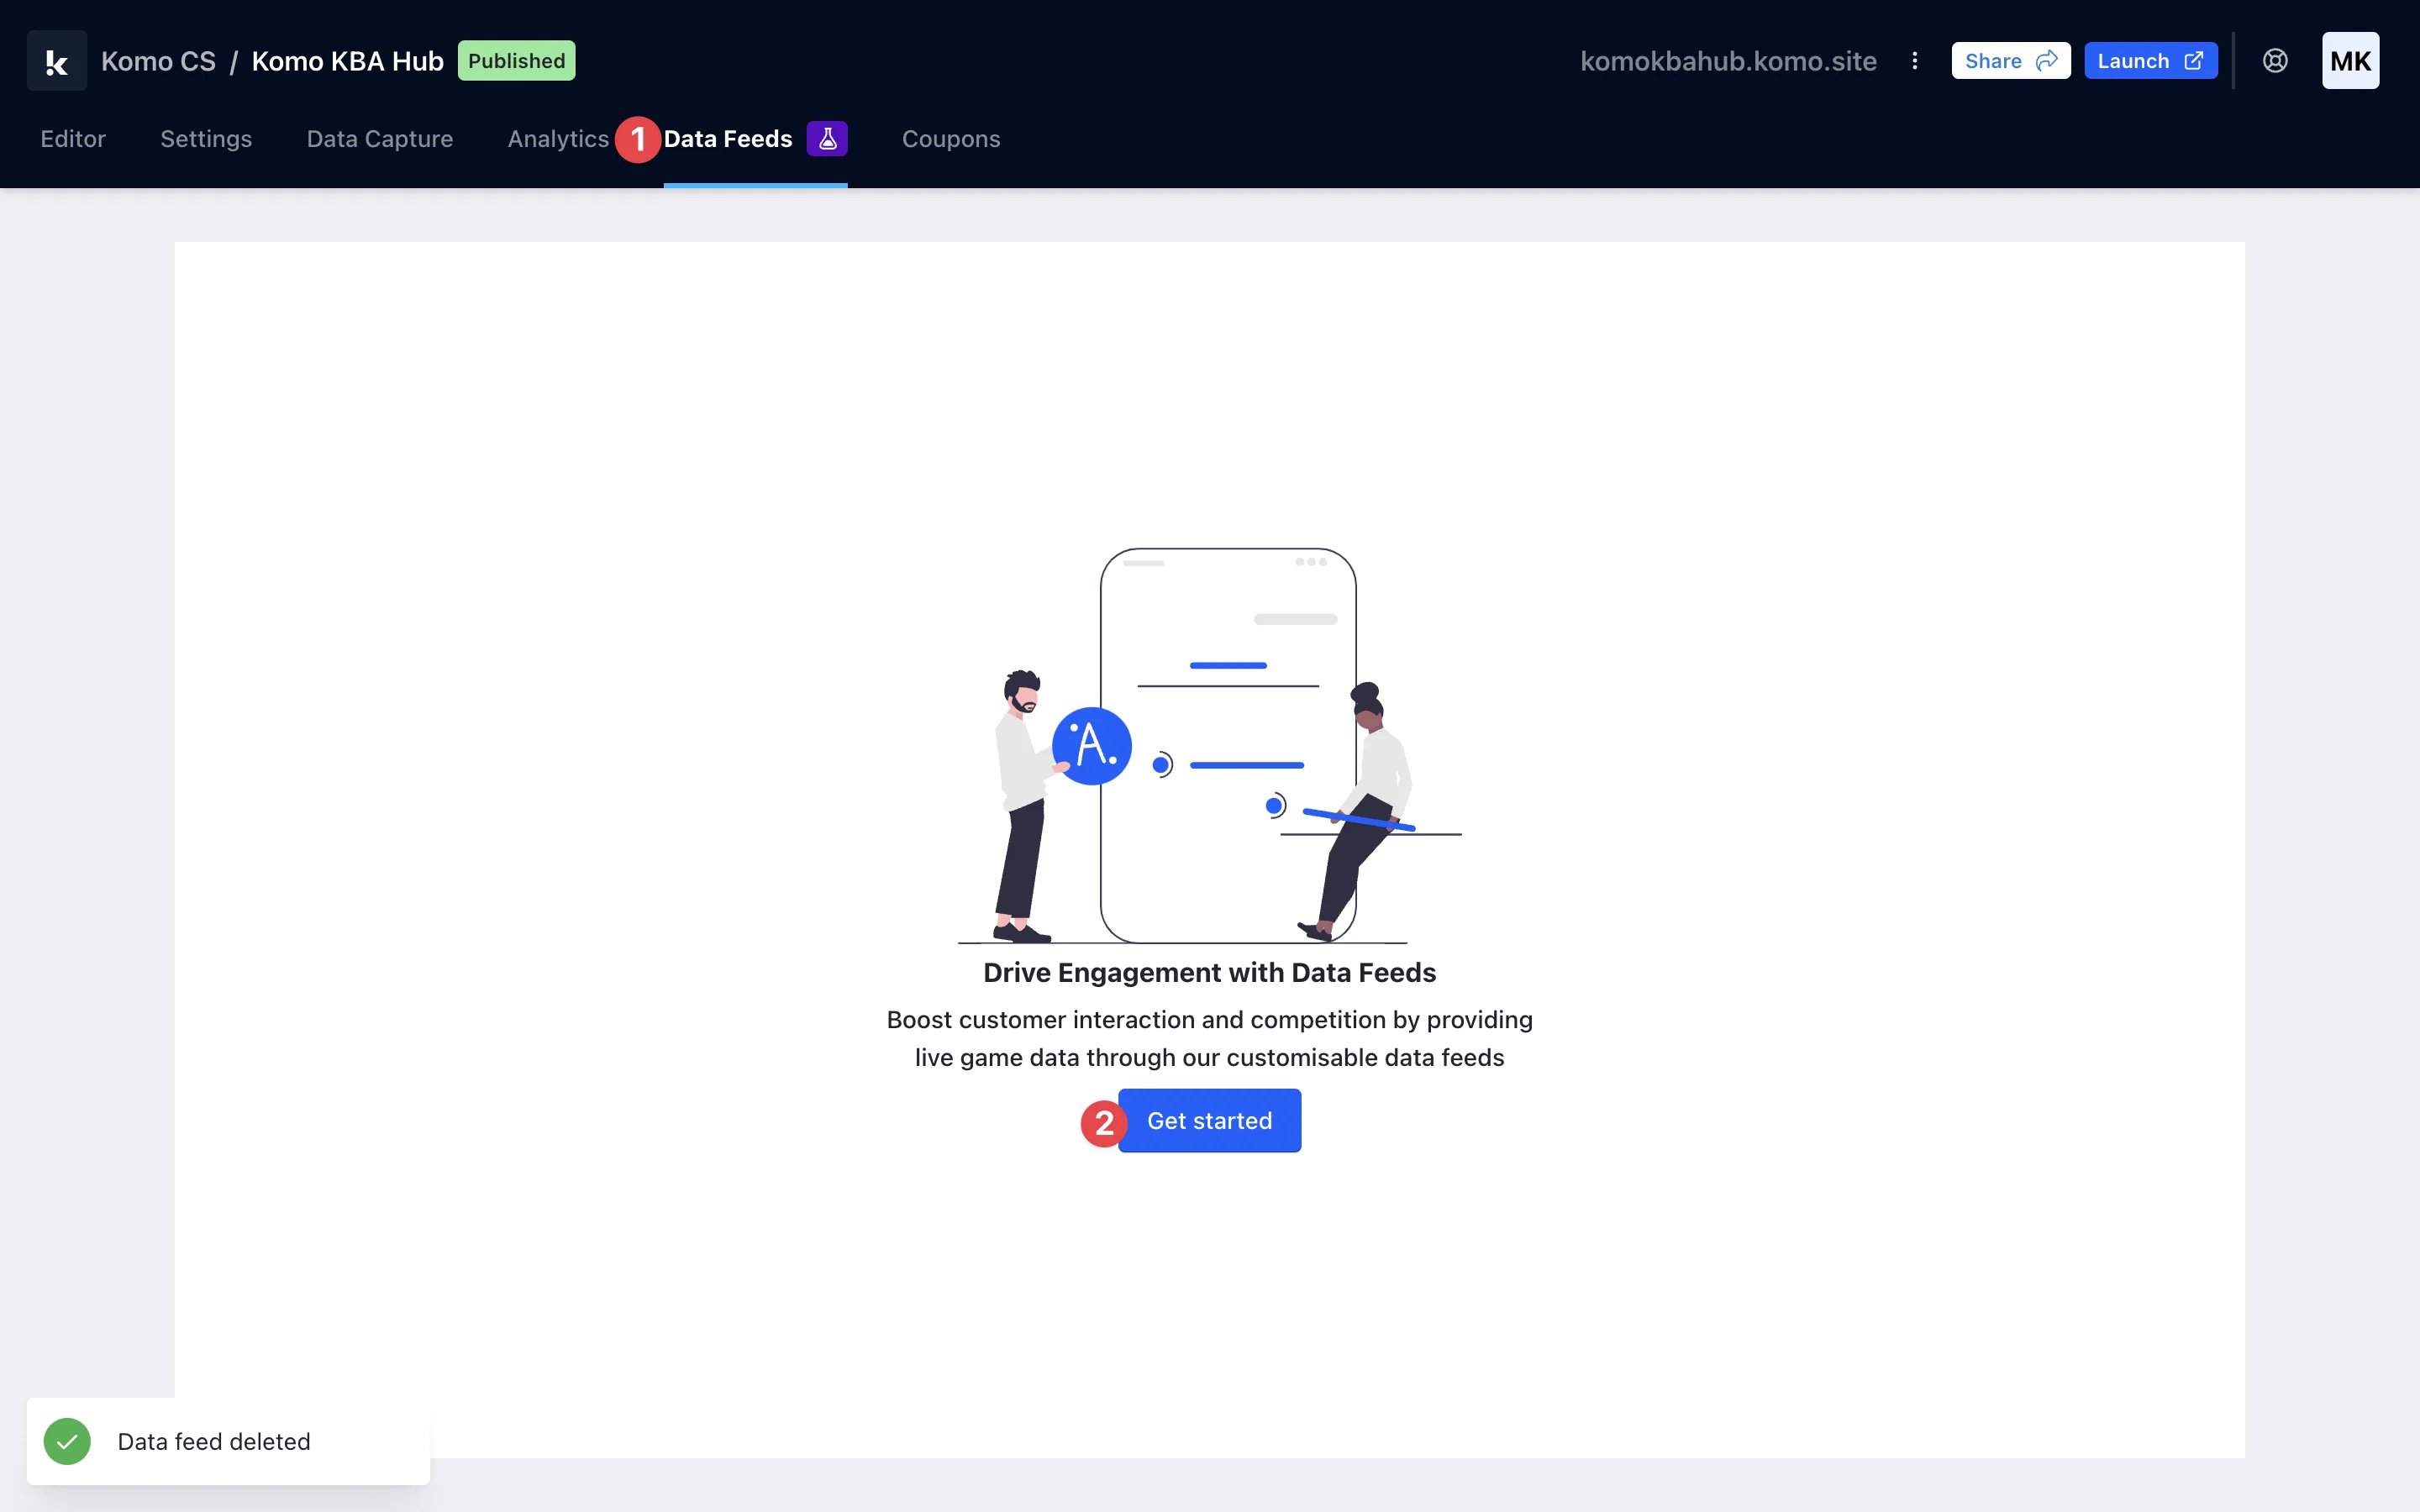
- (1) Navigate to the Data Feeds tab at the top of your screen.
- (2) Click the Get Started button to create a Data Feed.
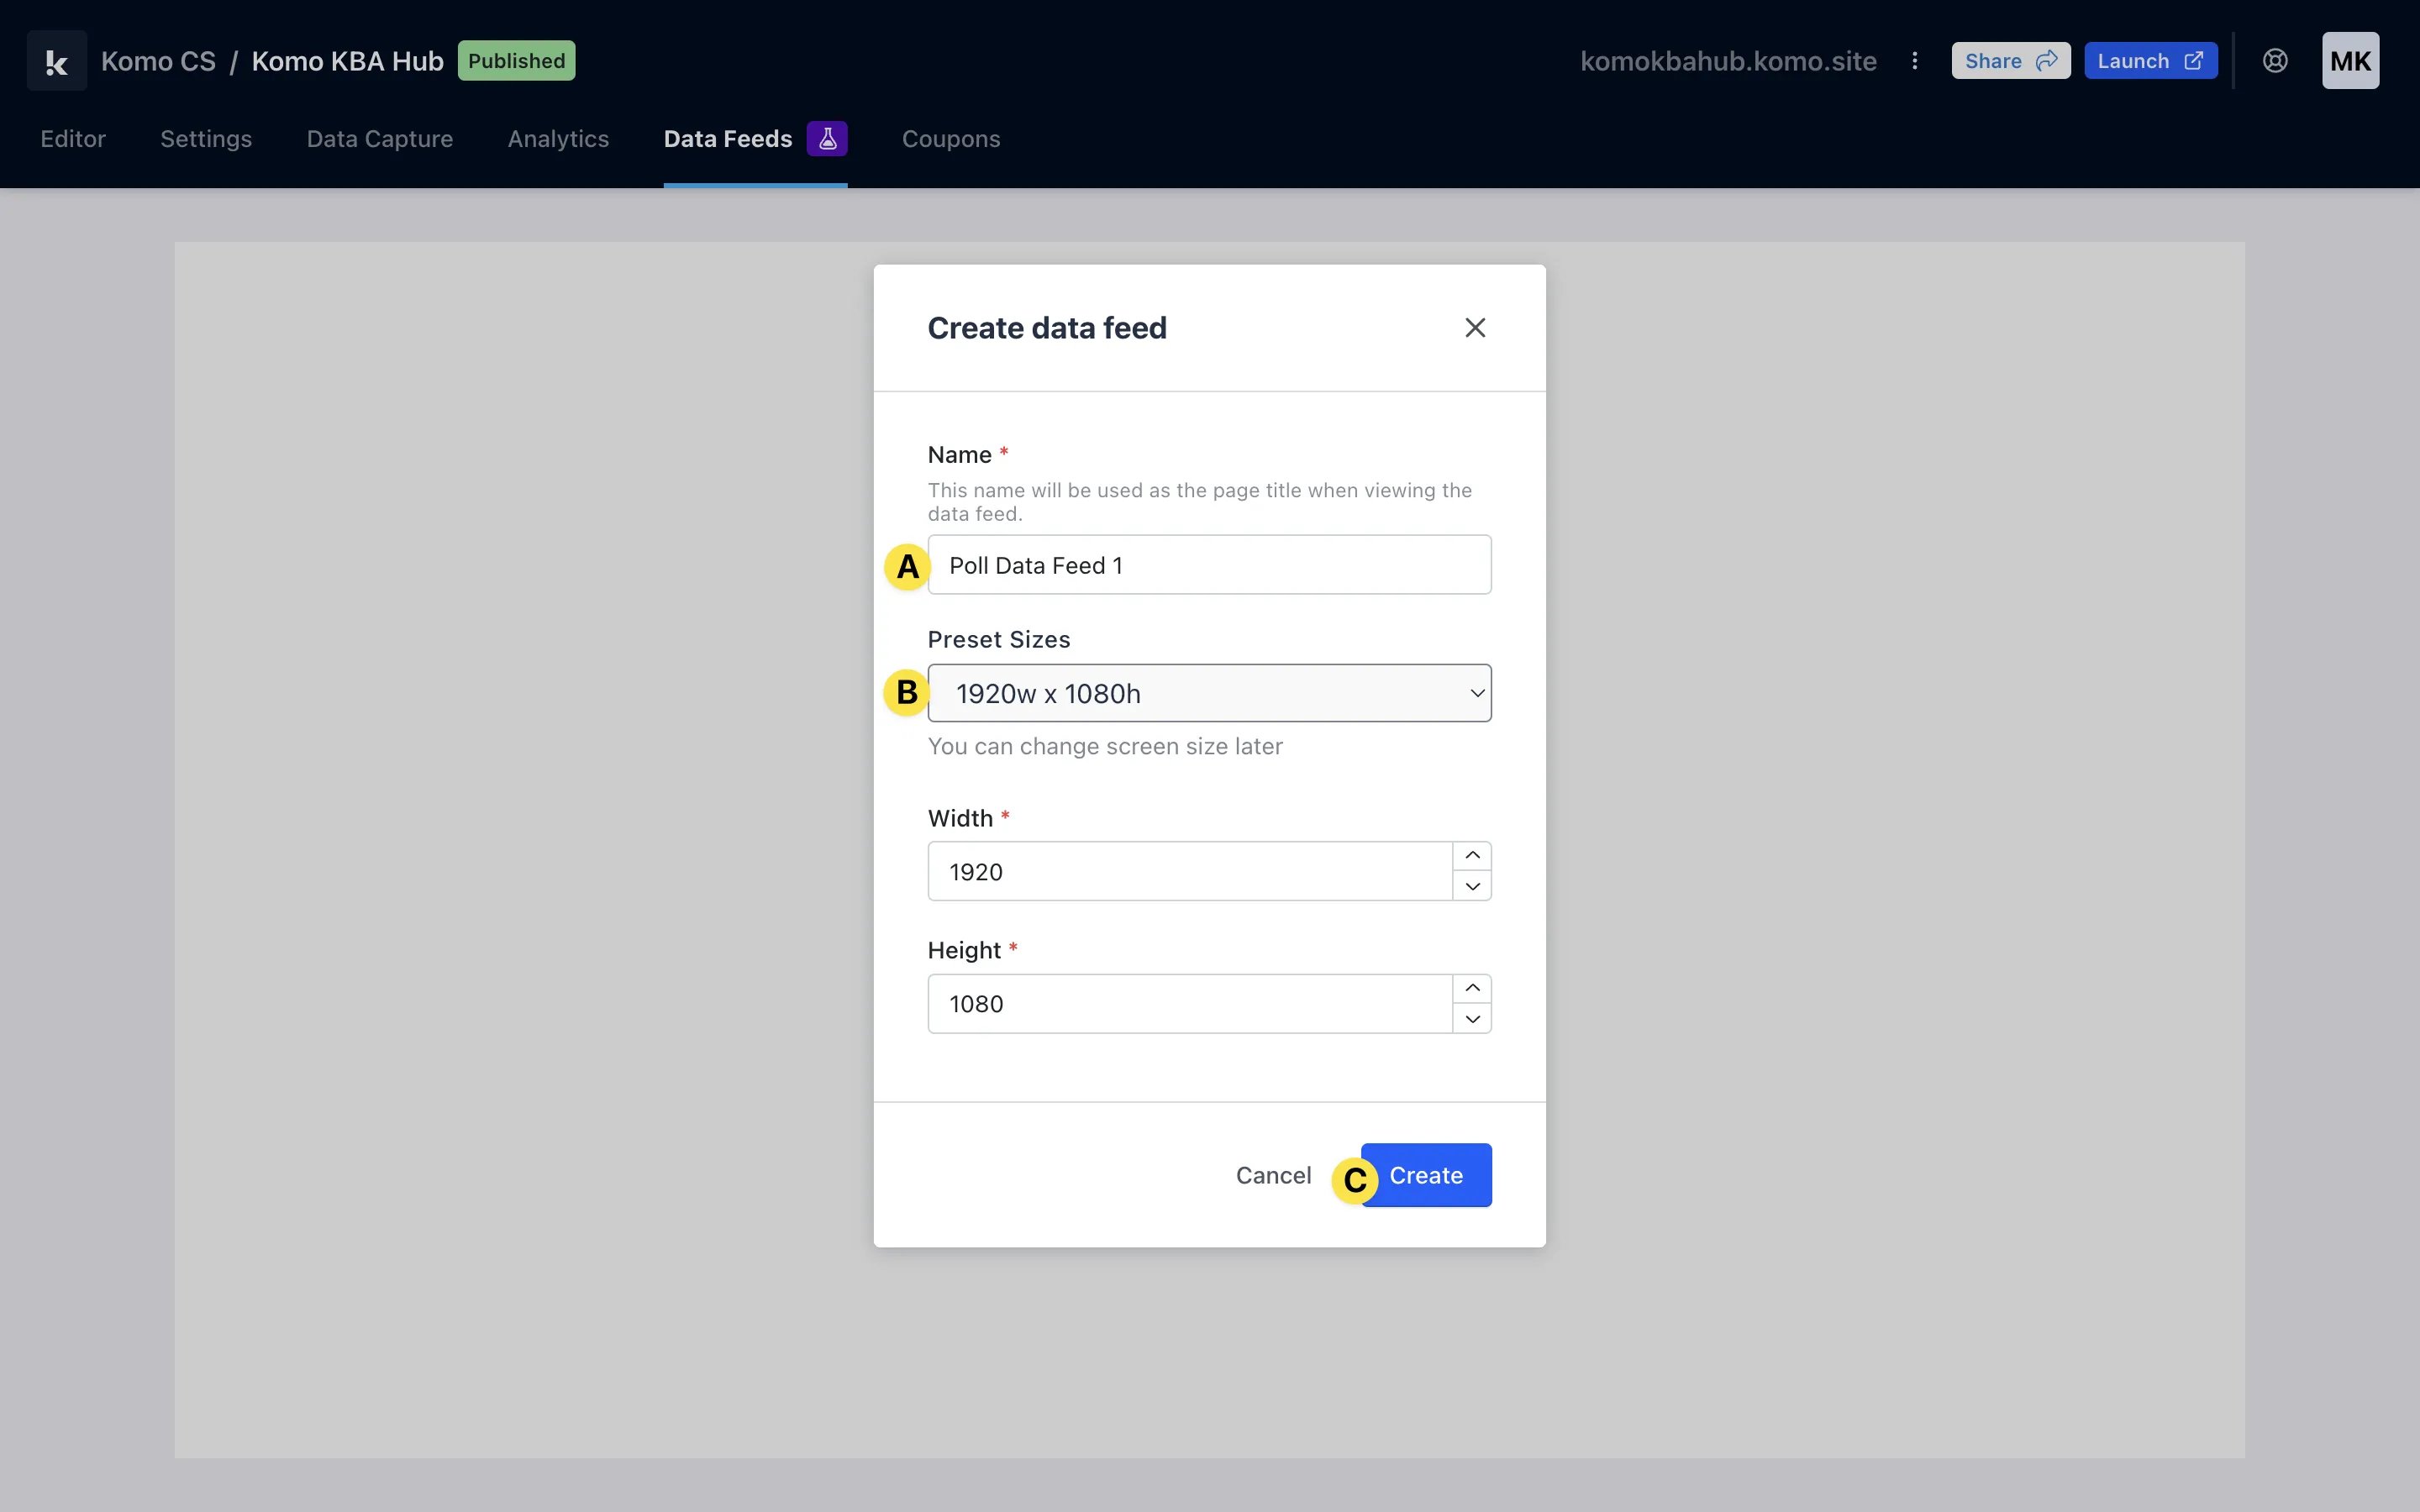
- (A) Name your Data Feed.
- (B) Choose your sizing from the pre-set sizes or set your own screen length and width.
- (C) Click Create.
Step 2: Configure your Data Feed layout
When you enter the editing modal, you will see the screens and layers panel on the left-hand side of your screen. Screens are where you can add more screens to one Data Feed and edit their metadata. Layers are where you will see the content you have added to your screen. A Stage is what we call a particular screen in a Data Feed. This is where you will add content to your Data Feed.
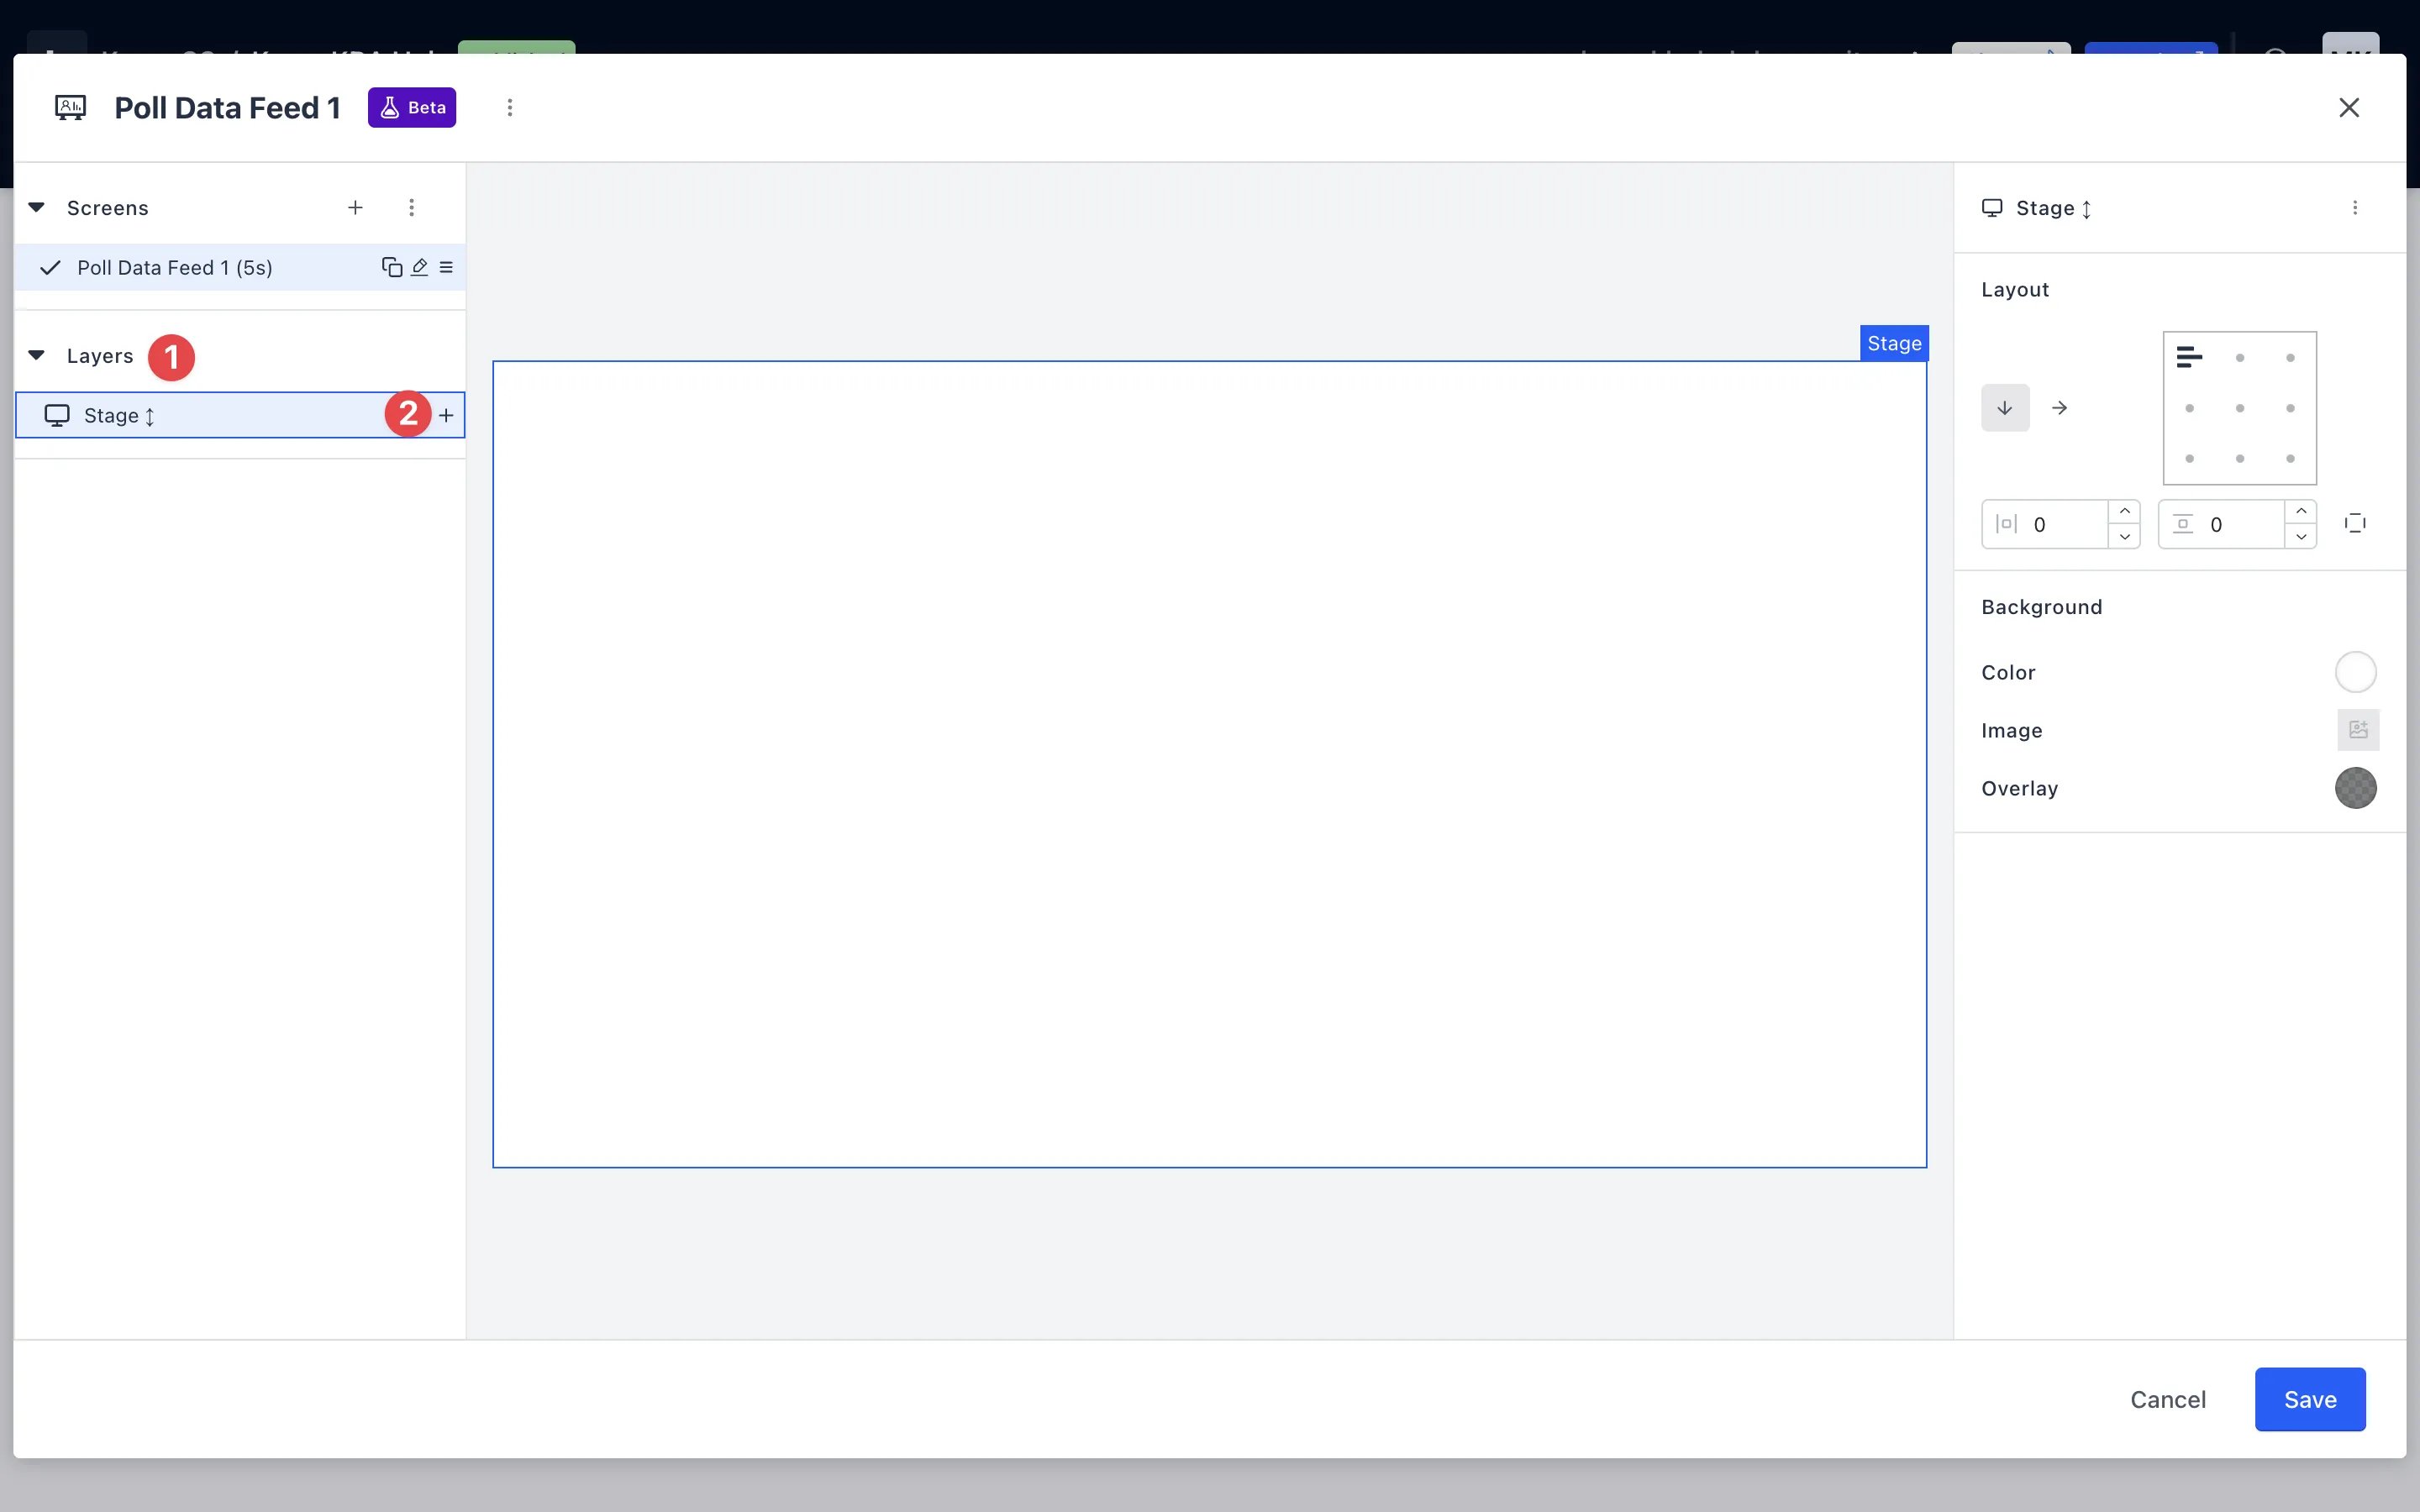
- (1) Navigate to the layers drop-down menu in the left-hand panel.
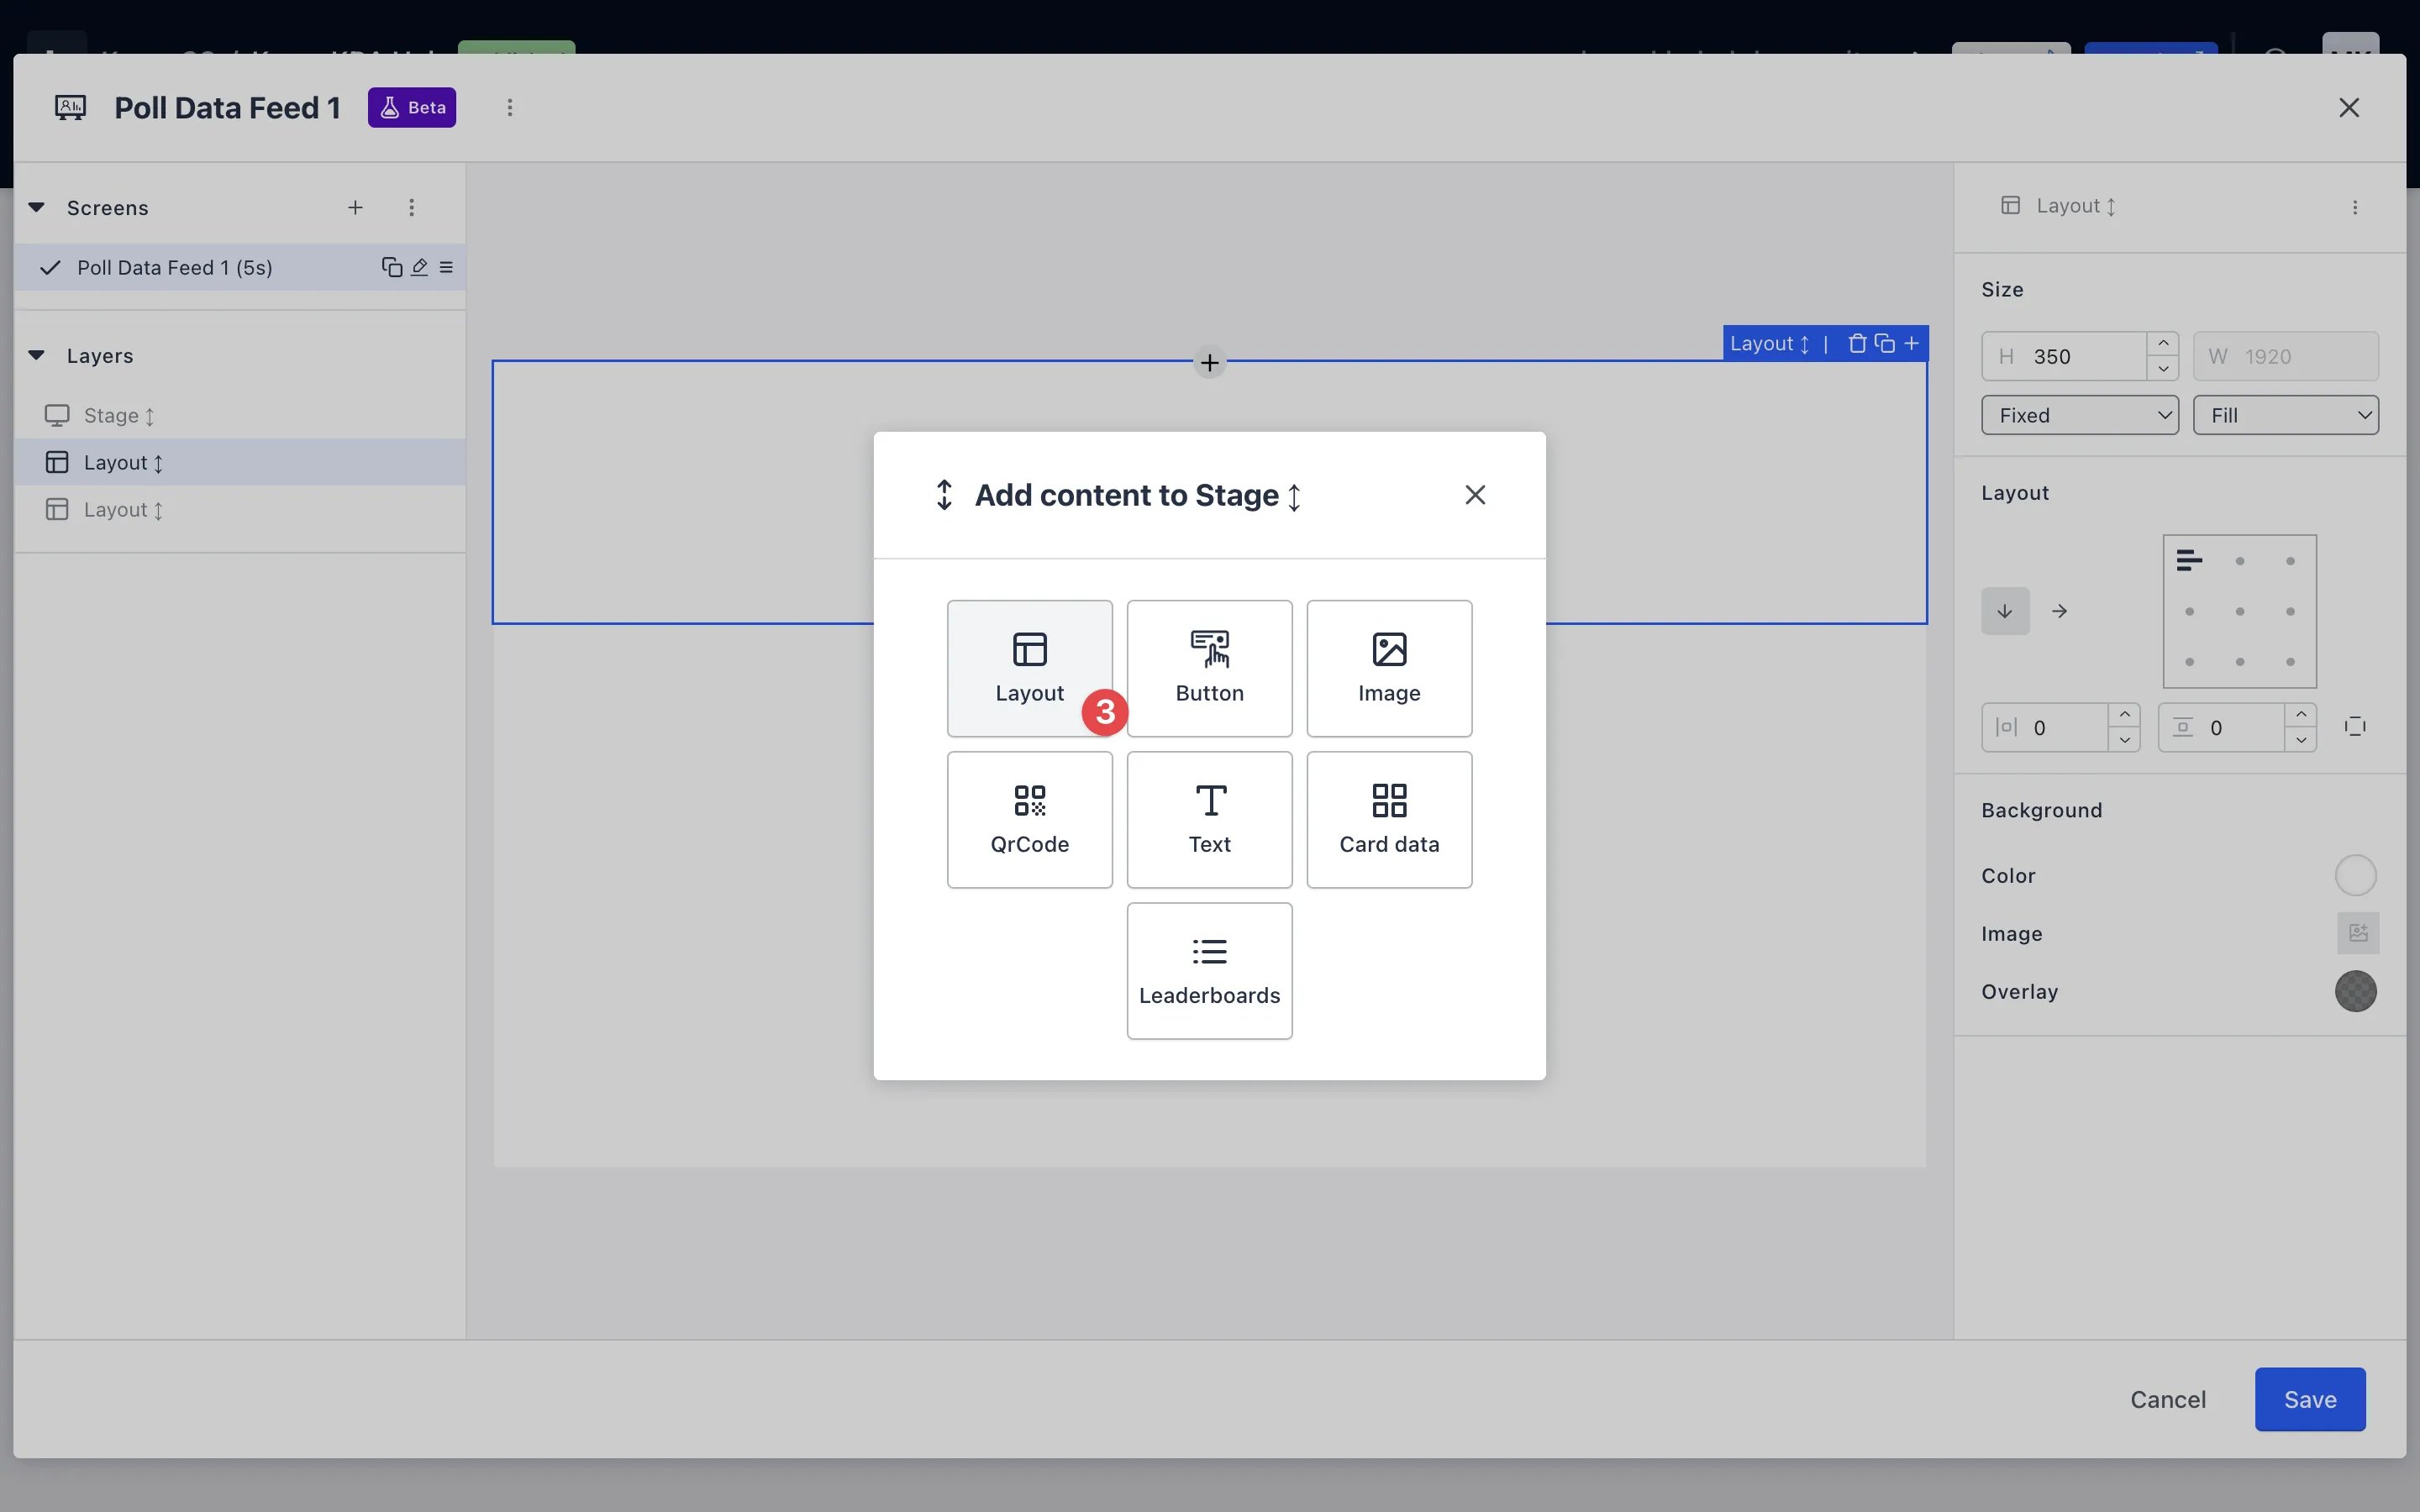
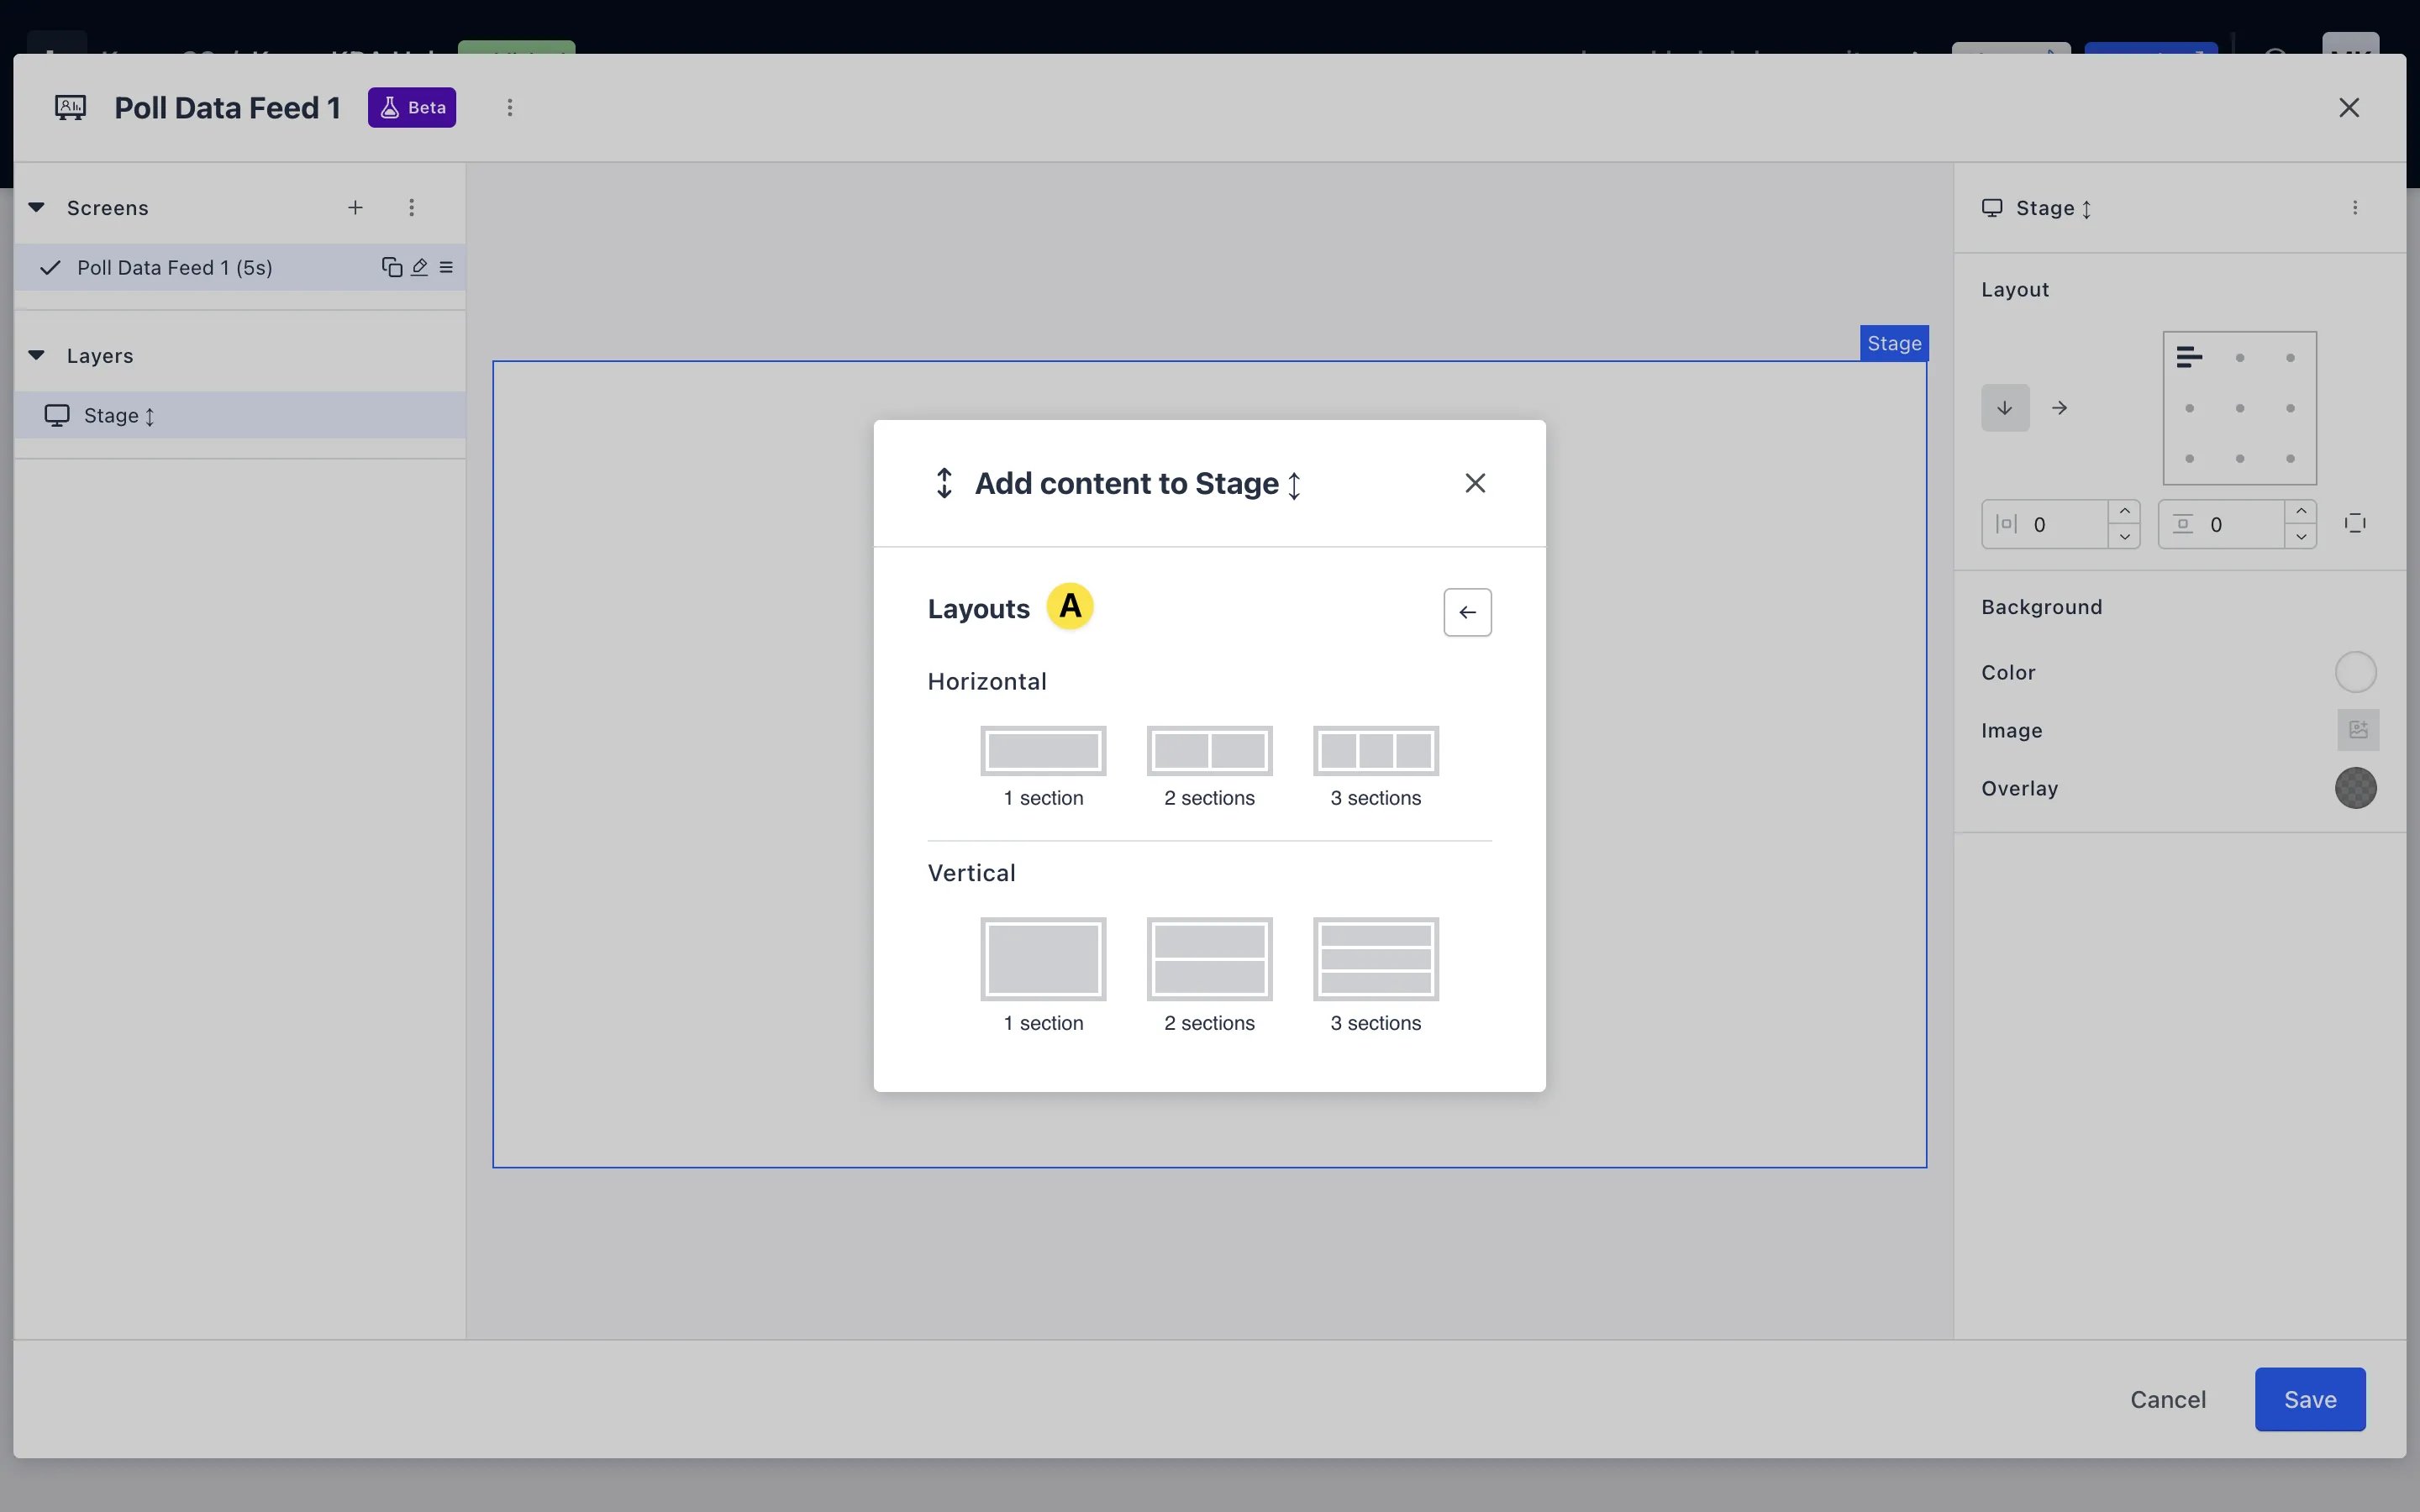
- (3) Click Layout to select a layout (A) to add to your Screen. Choose from a range of horizontal and vertical layouts.
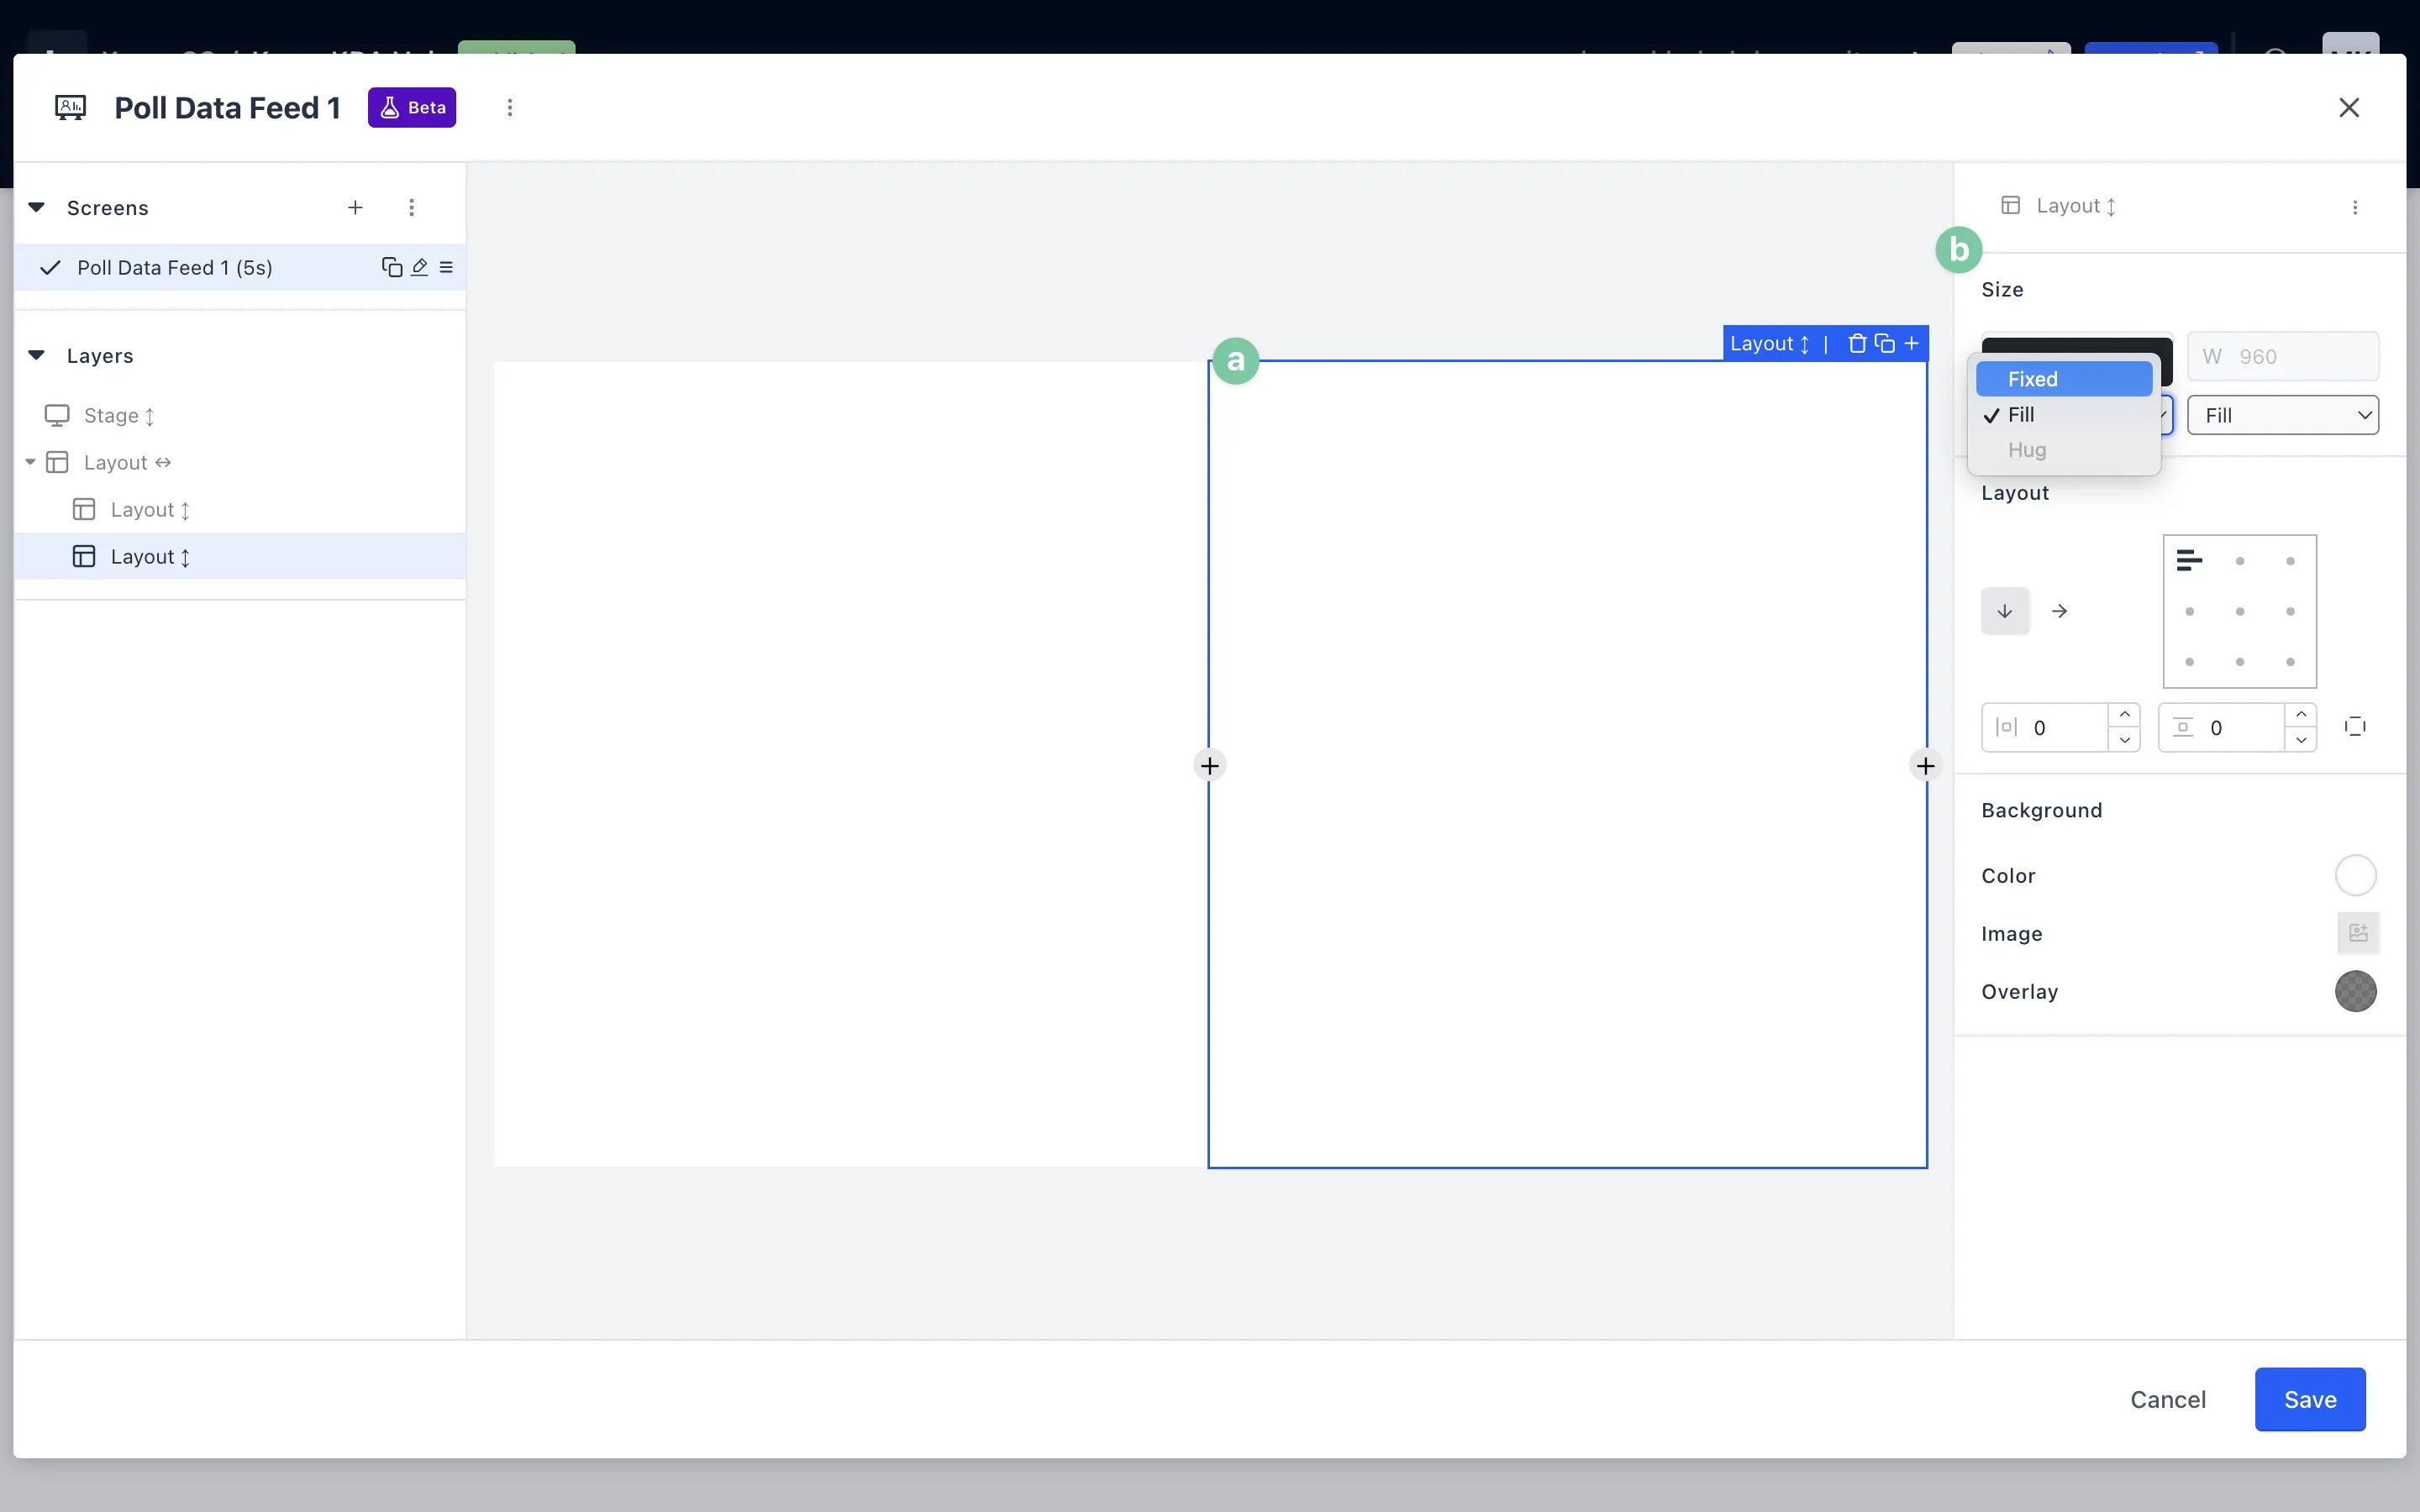
- (A) To edit the dimensions of each layout section you have just added, click on the section you want to edit to select it and navigate to the settings panel on the right-hand side of the editing modal.
- (B) To make changes to the width and/or height, click on the drop-down menu under these dimensions and select fixed. From there, enter the dimensions you wish for the section to display.
- Once you have adjusted the dimensions of your sections, you can begin to add content to your layout.
Steps 3-8 are all optional, depending on the content you wish to add to the Data Feed!
Step 3: Add an image to your Data Feed
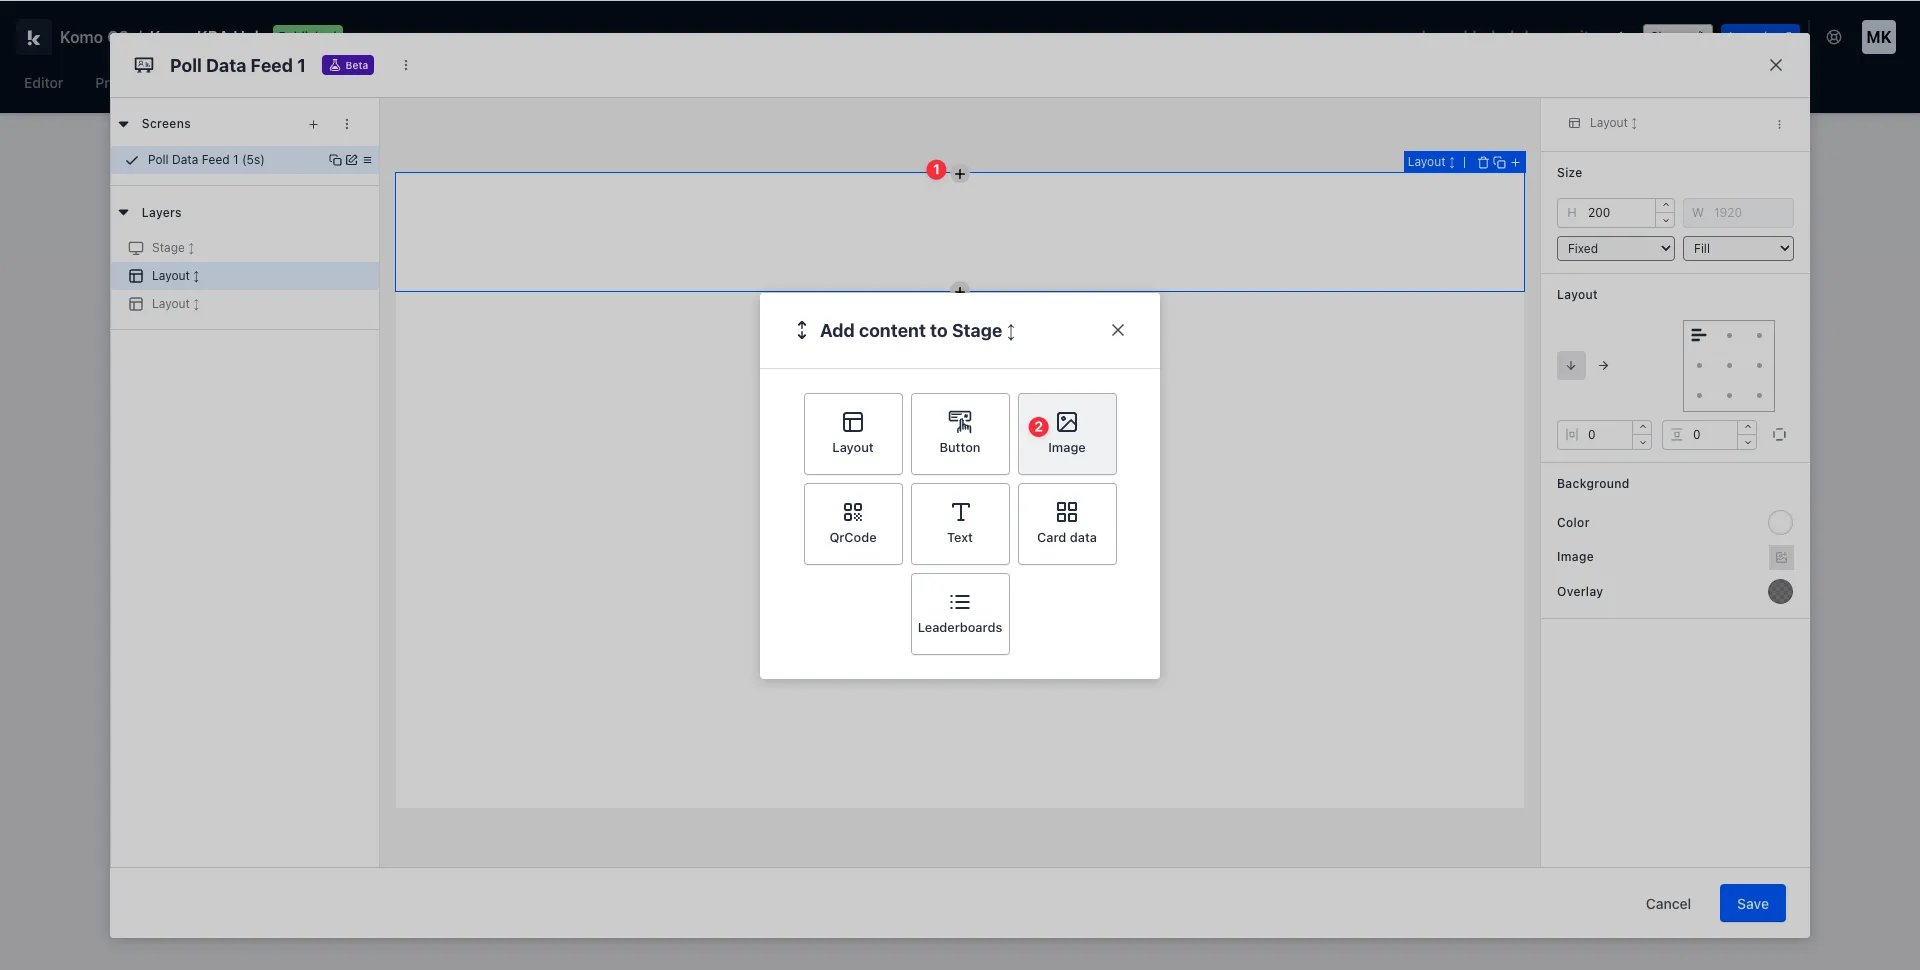
- (1) To add an image to your Data Feed, select the section you wish to add the button to and click the + icon that appears.
- (2) Select the image from the add content menu.
- (A) Upload an image from your device, or choose an image from our Canva, Unsplash and Giphy integrations.
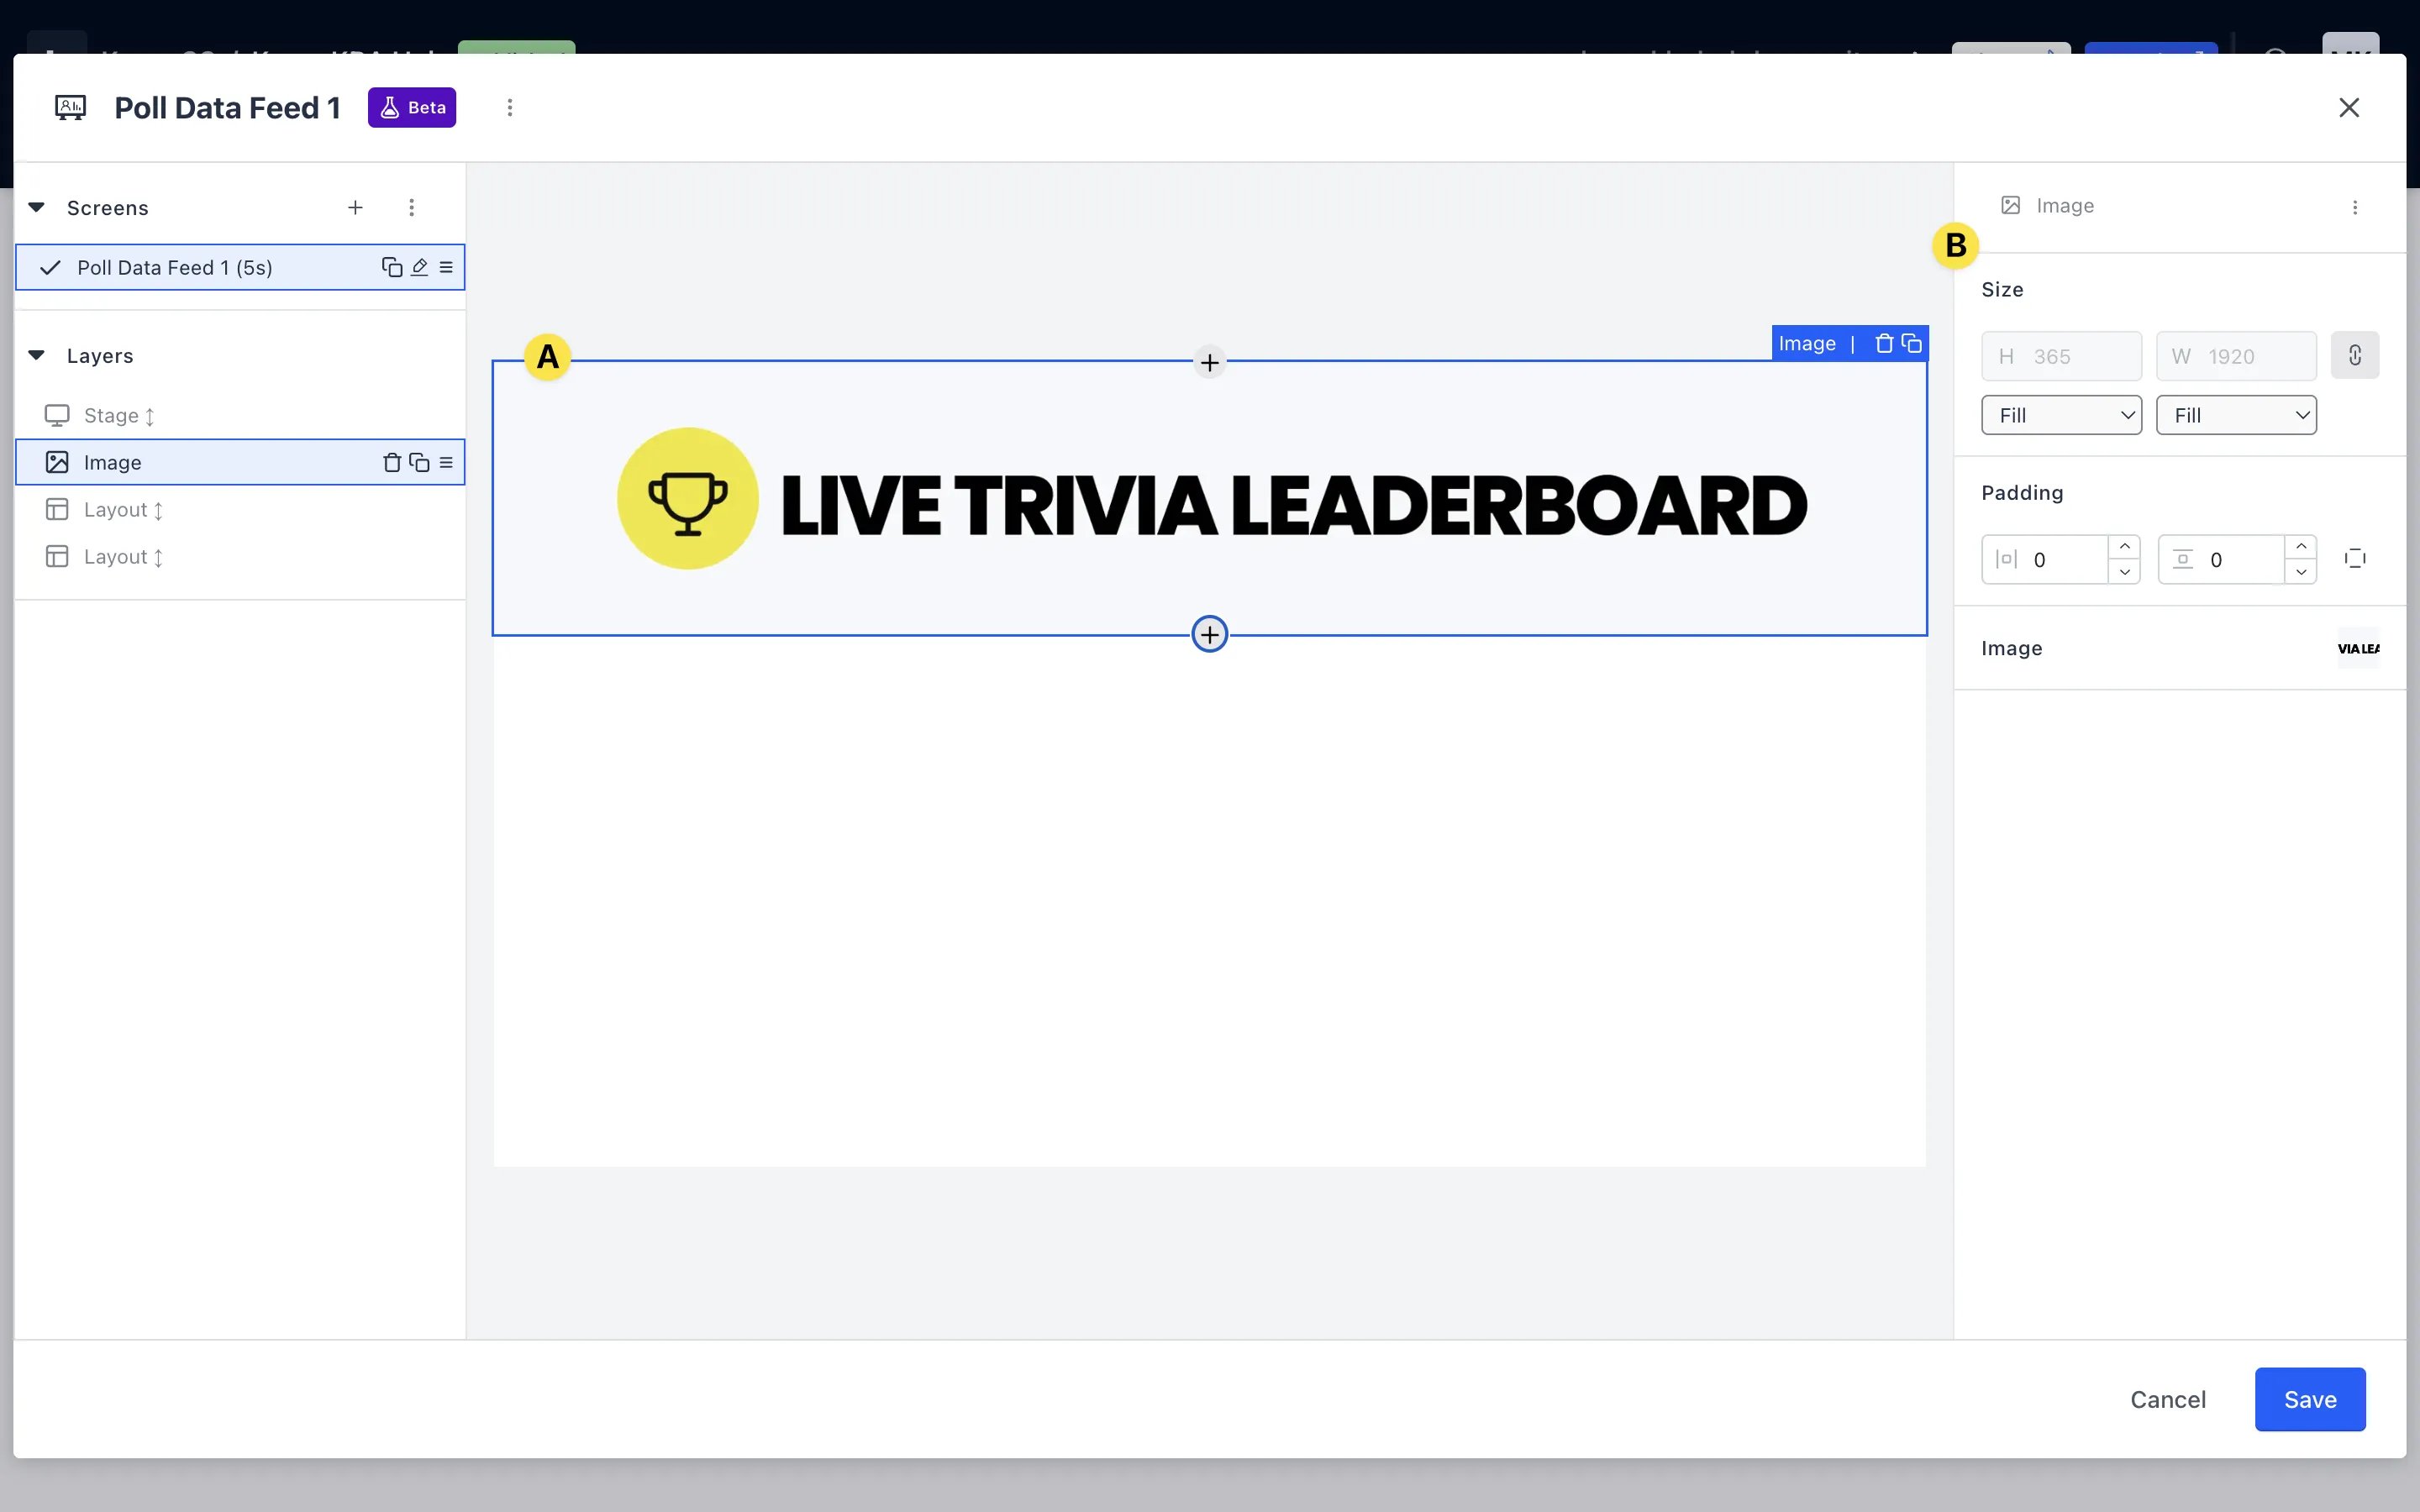
- (B) Once added, you can edit your image by selecting it and navigating to the right-hand settings panel.
- (C) Use the settings panel to adjust the dimensions and styling of your image.
Step 4: Add a QR code to your Data Feed
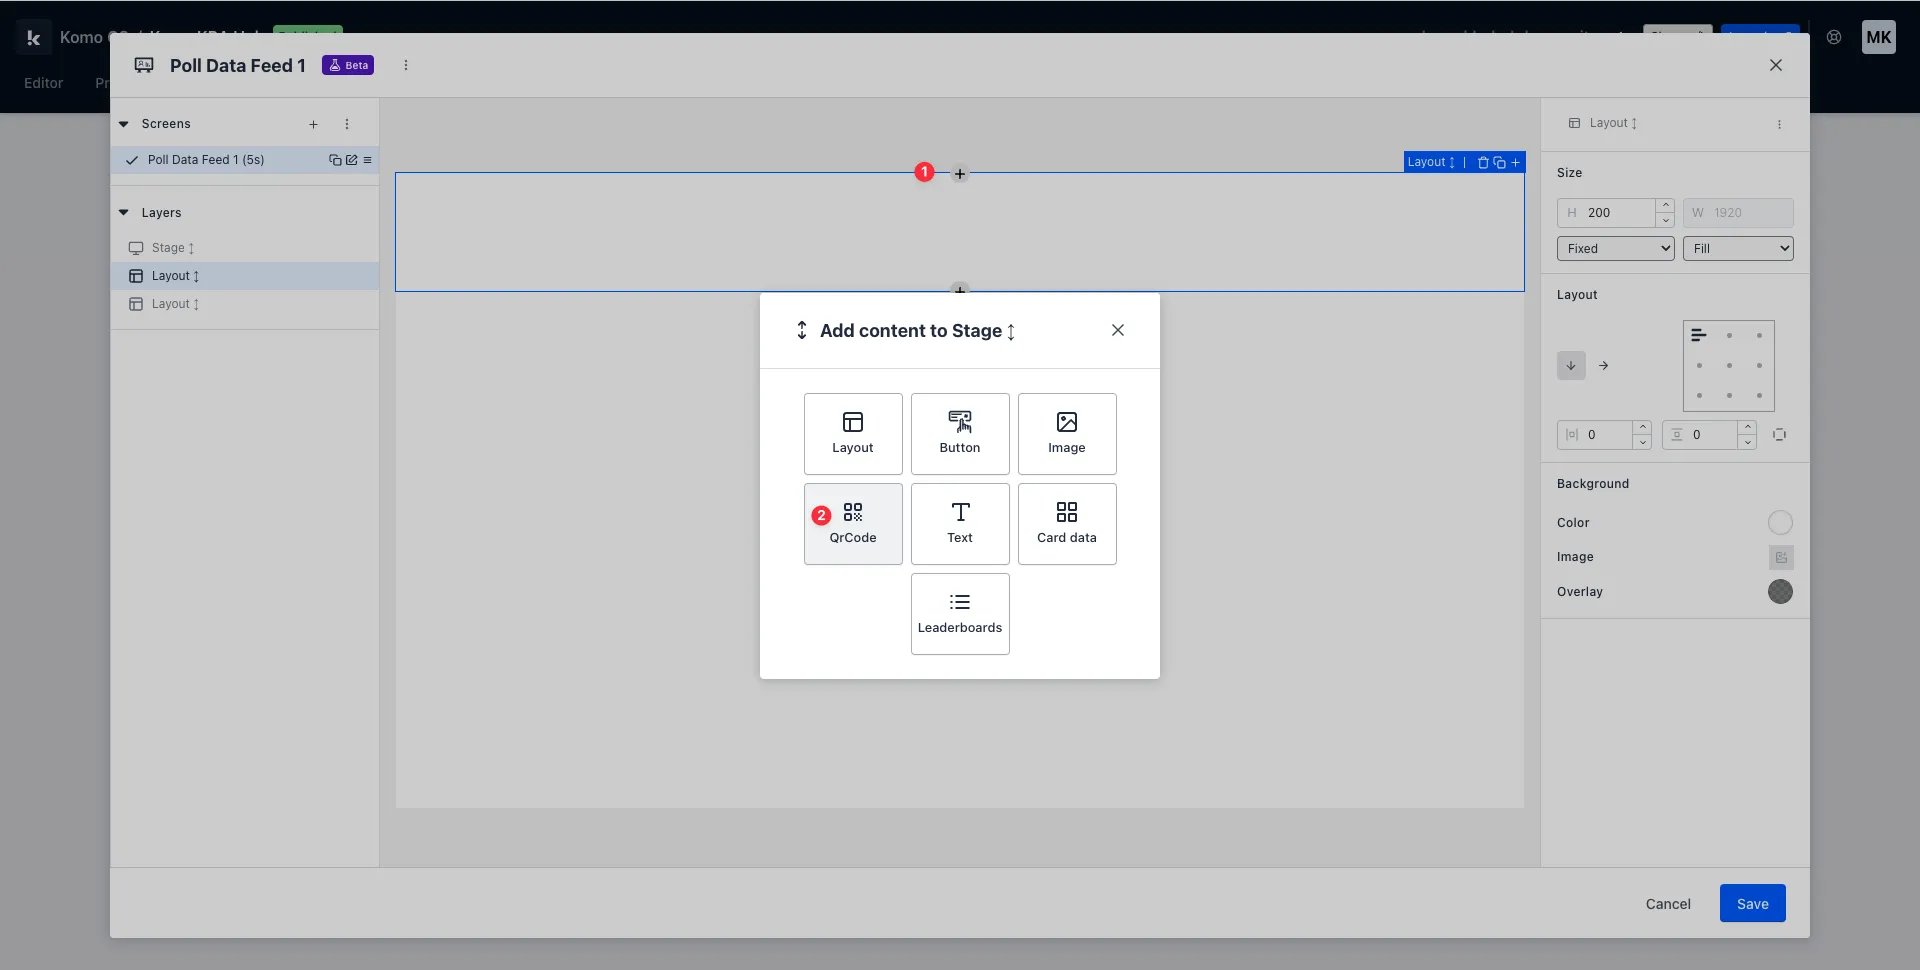
- (1) To add a QR code to your Data Feed, select the section you wish to add the button to and click the + icon that appears.
- (2) Select the QR code from the add content menu.
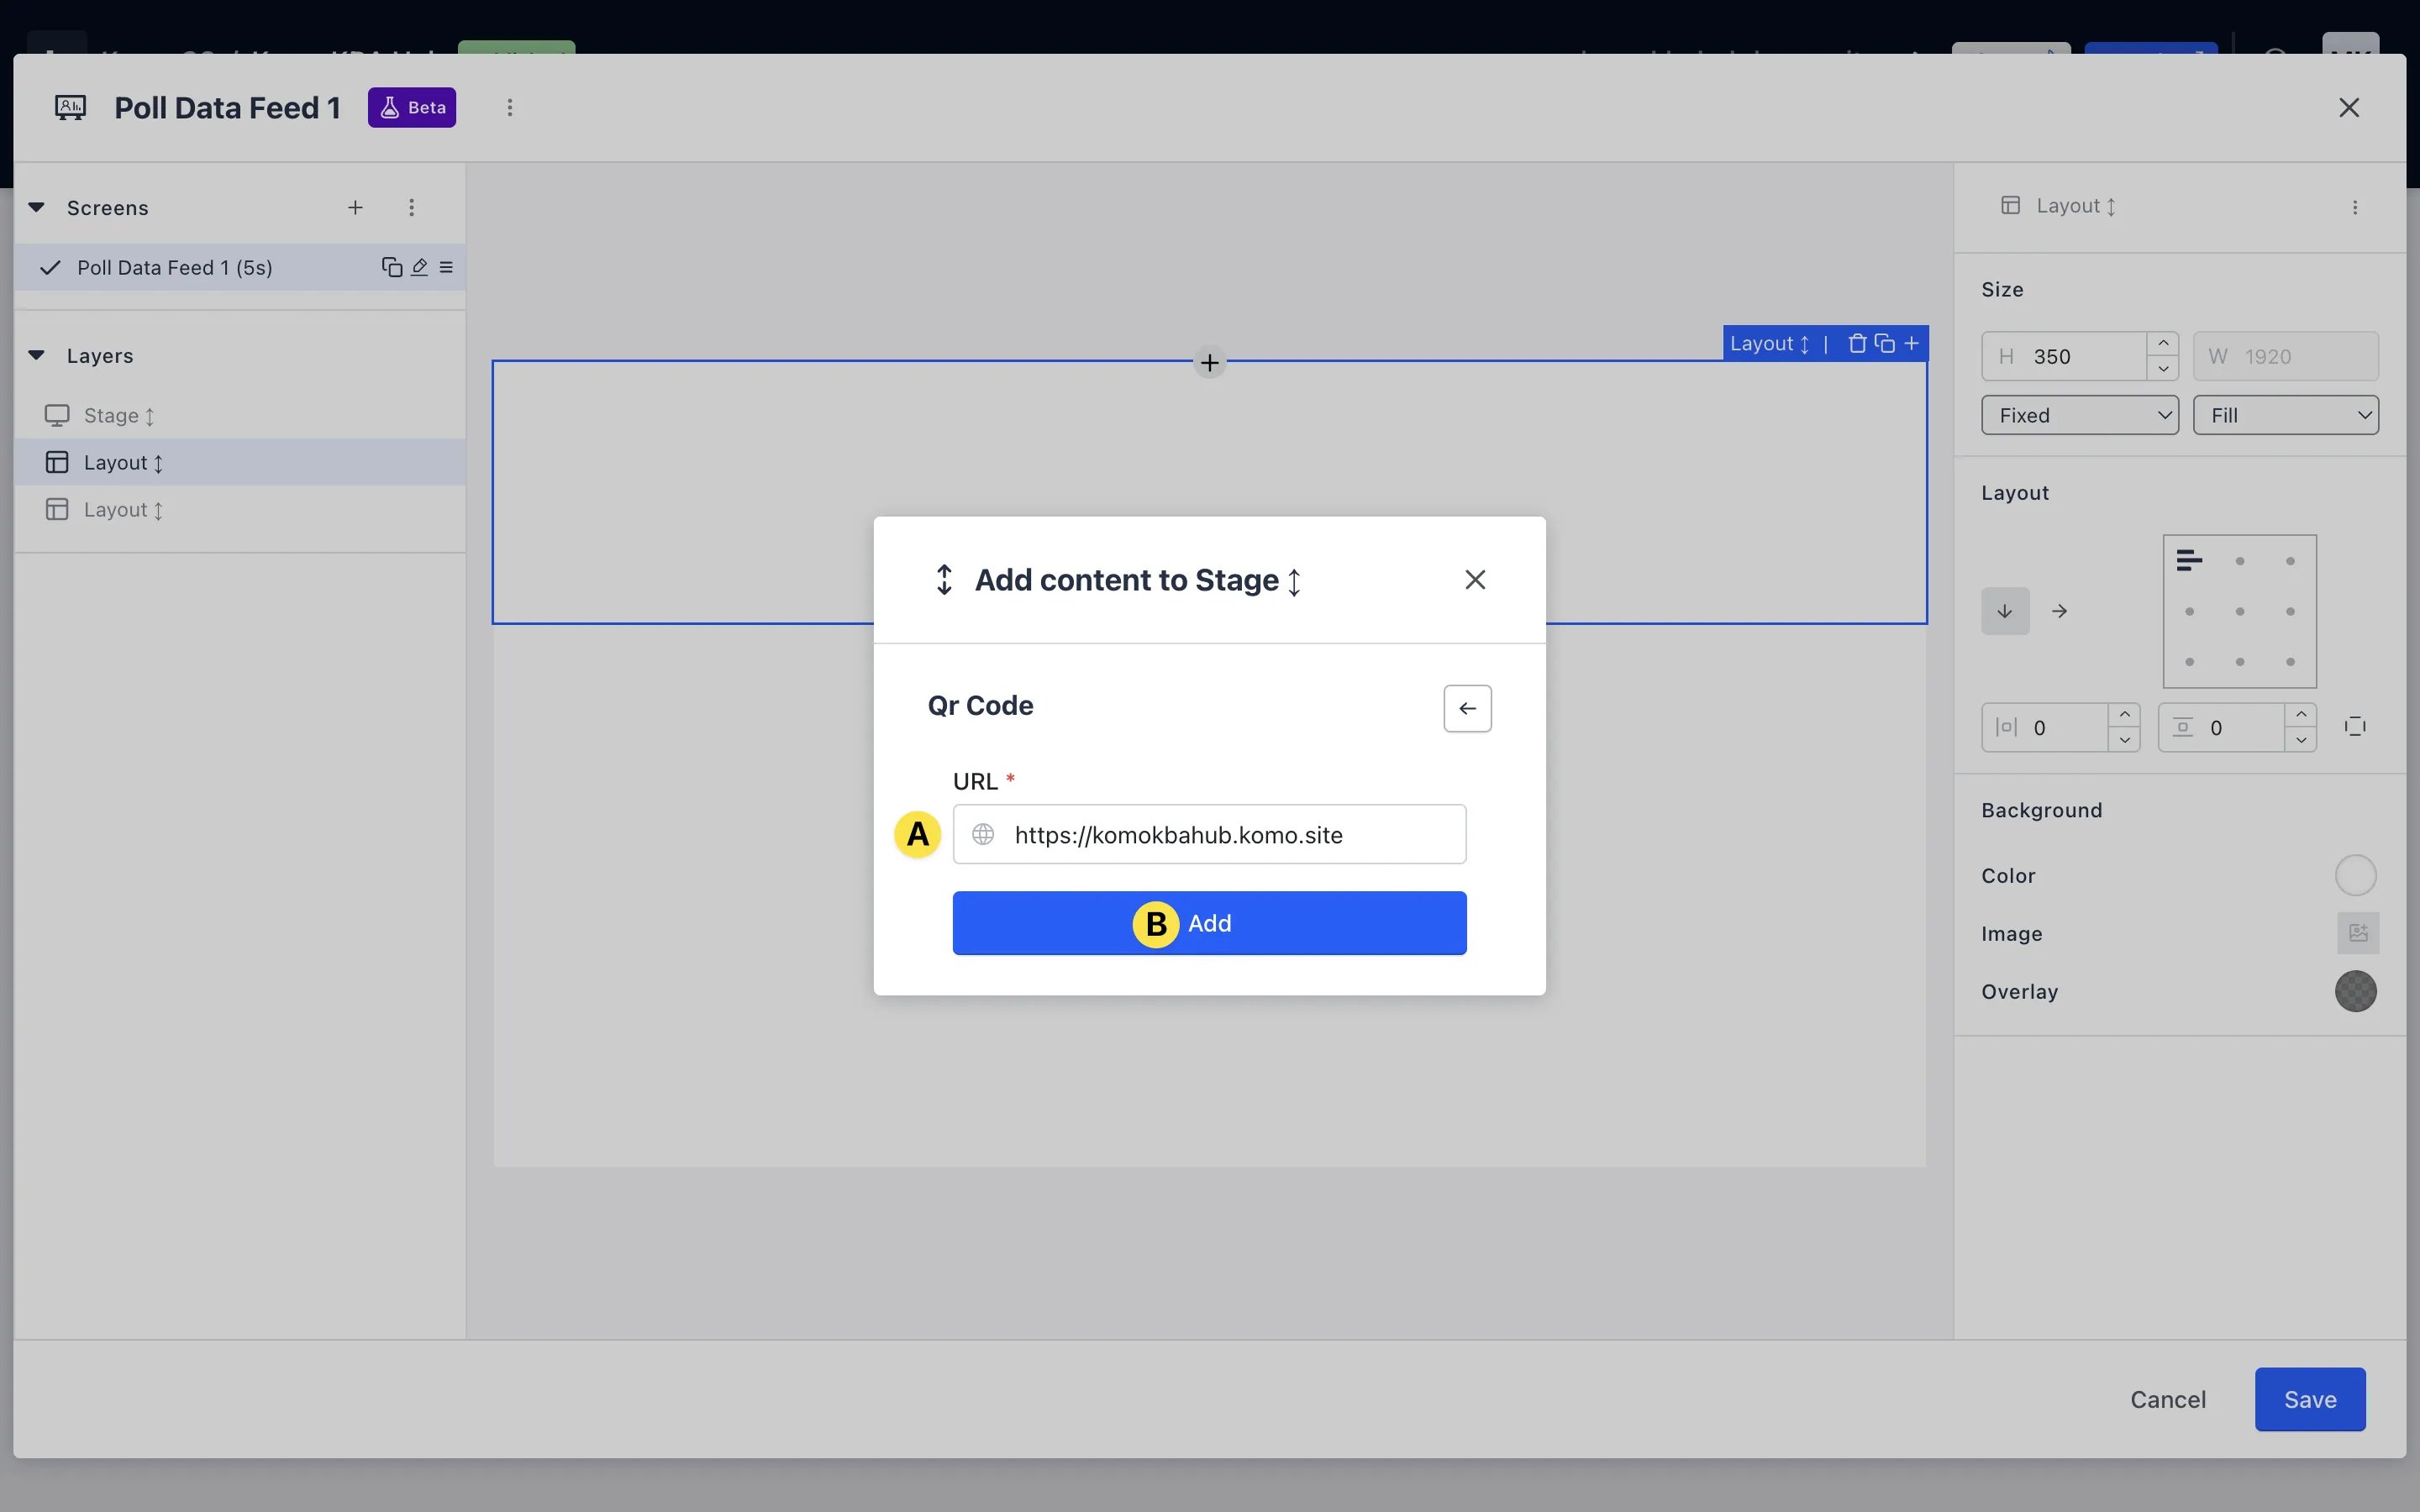
- (A) Input the destination URL for your QR code. This will automatically fill with the URL for your Engagement Hub but you can change it if you wish.
- (B) Click add.
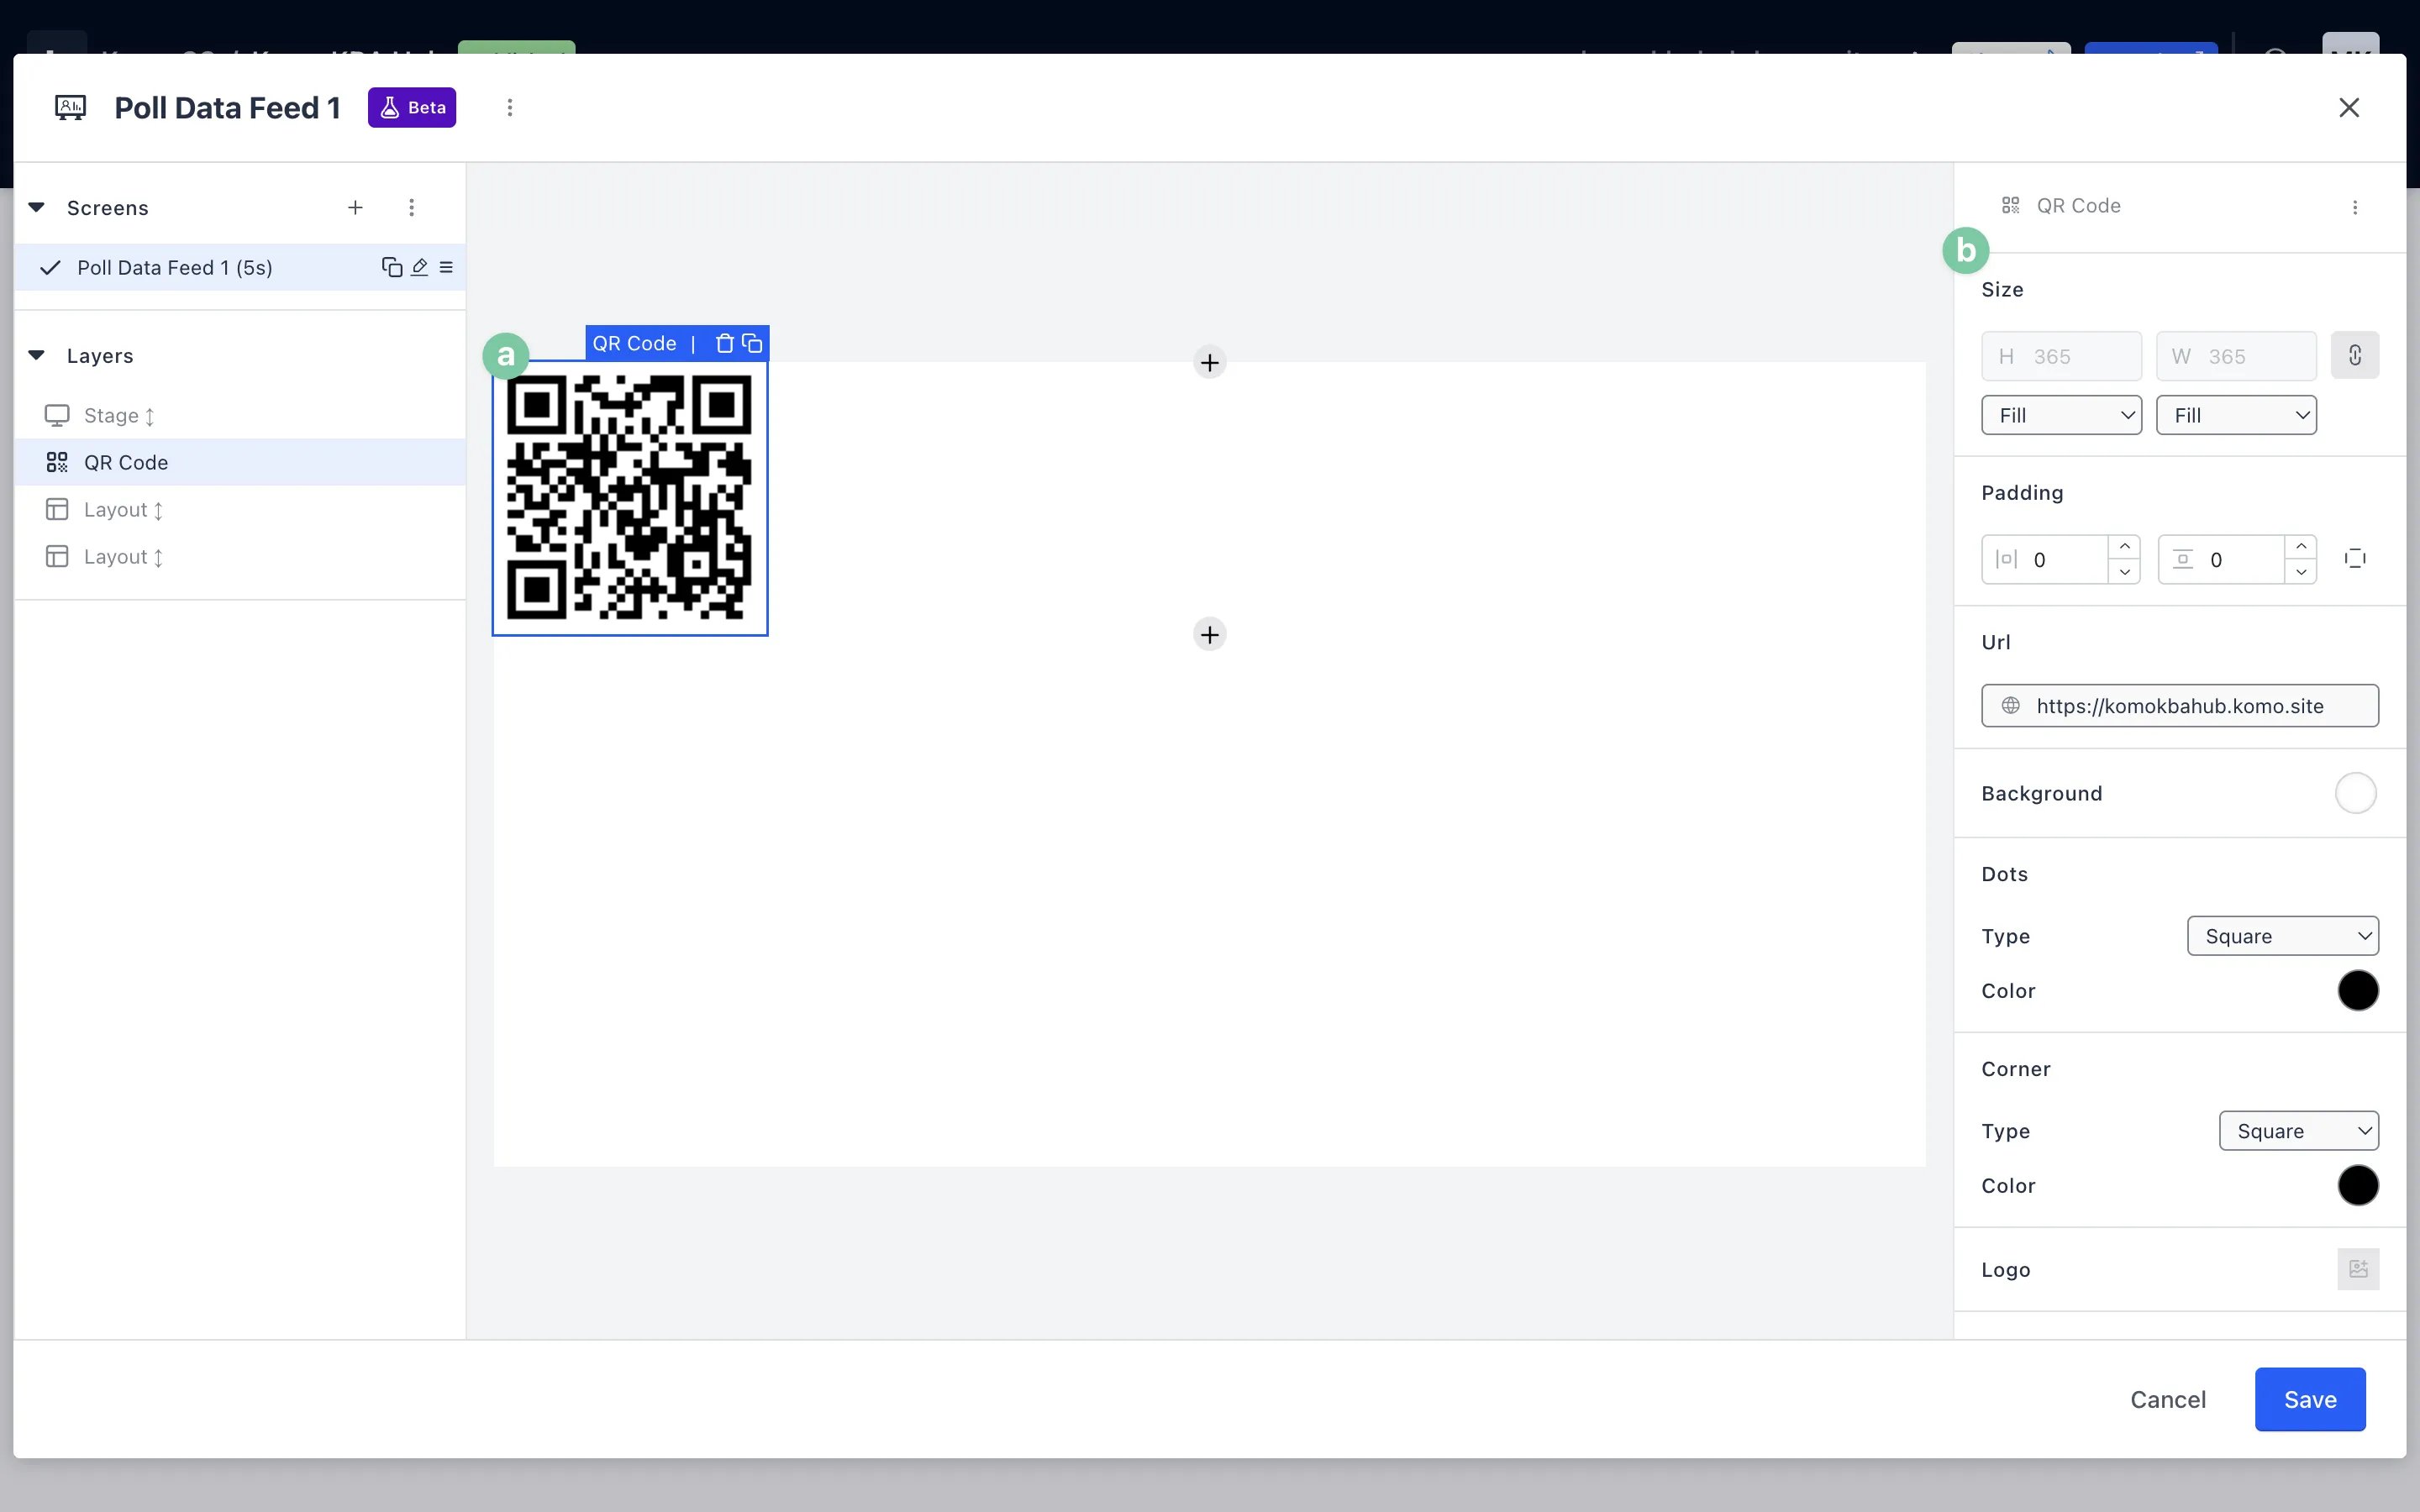
- (a) Once added, you can edit your QR code by selecting it and navigating to the right-hand settings panel.
- (b) Use the settings panel to adjust the dimensions and styling of your QR code.
Step 5: Add text to your Data Feed
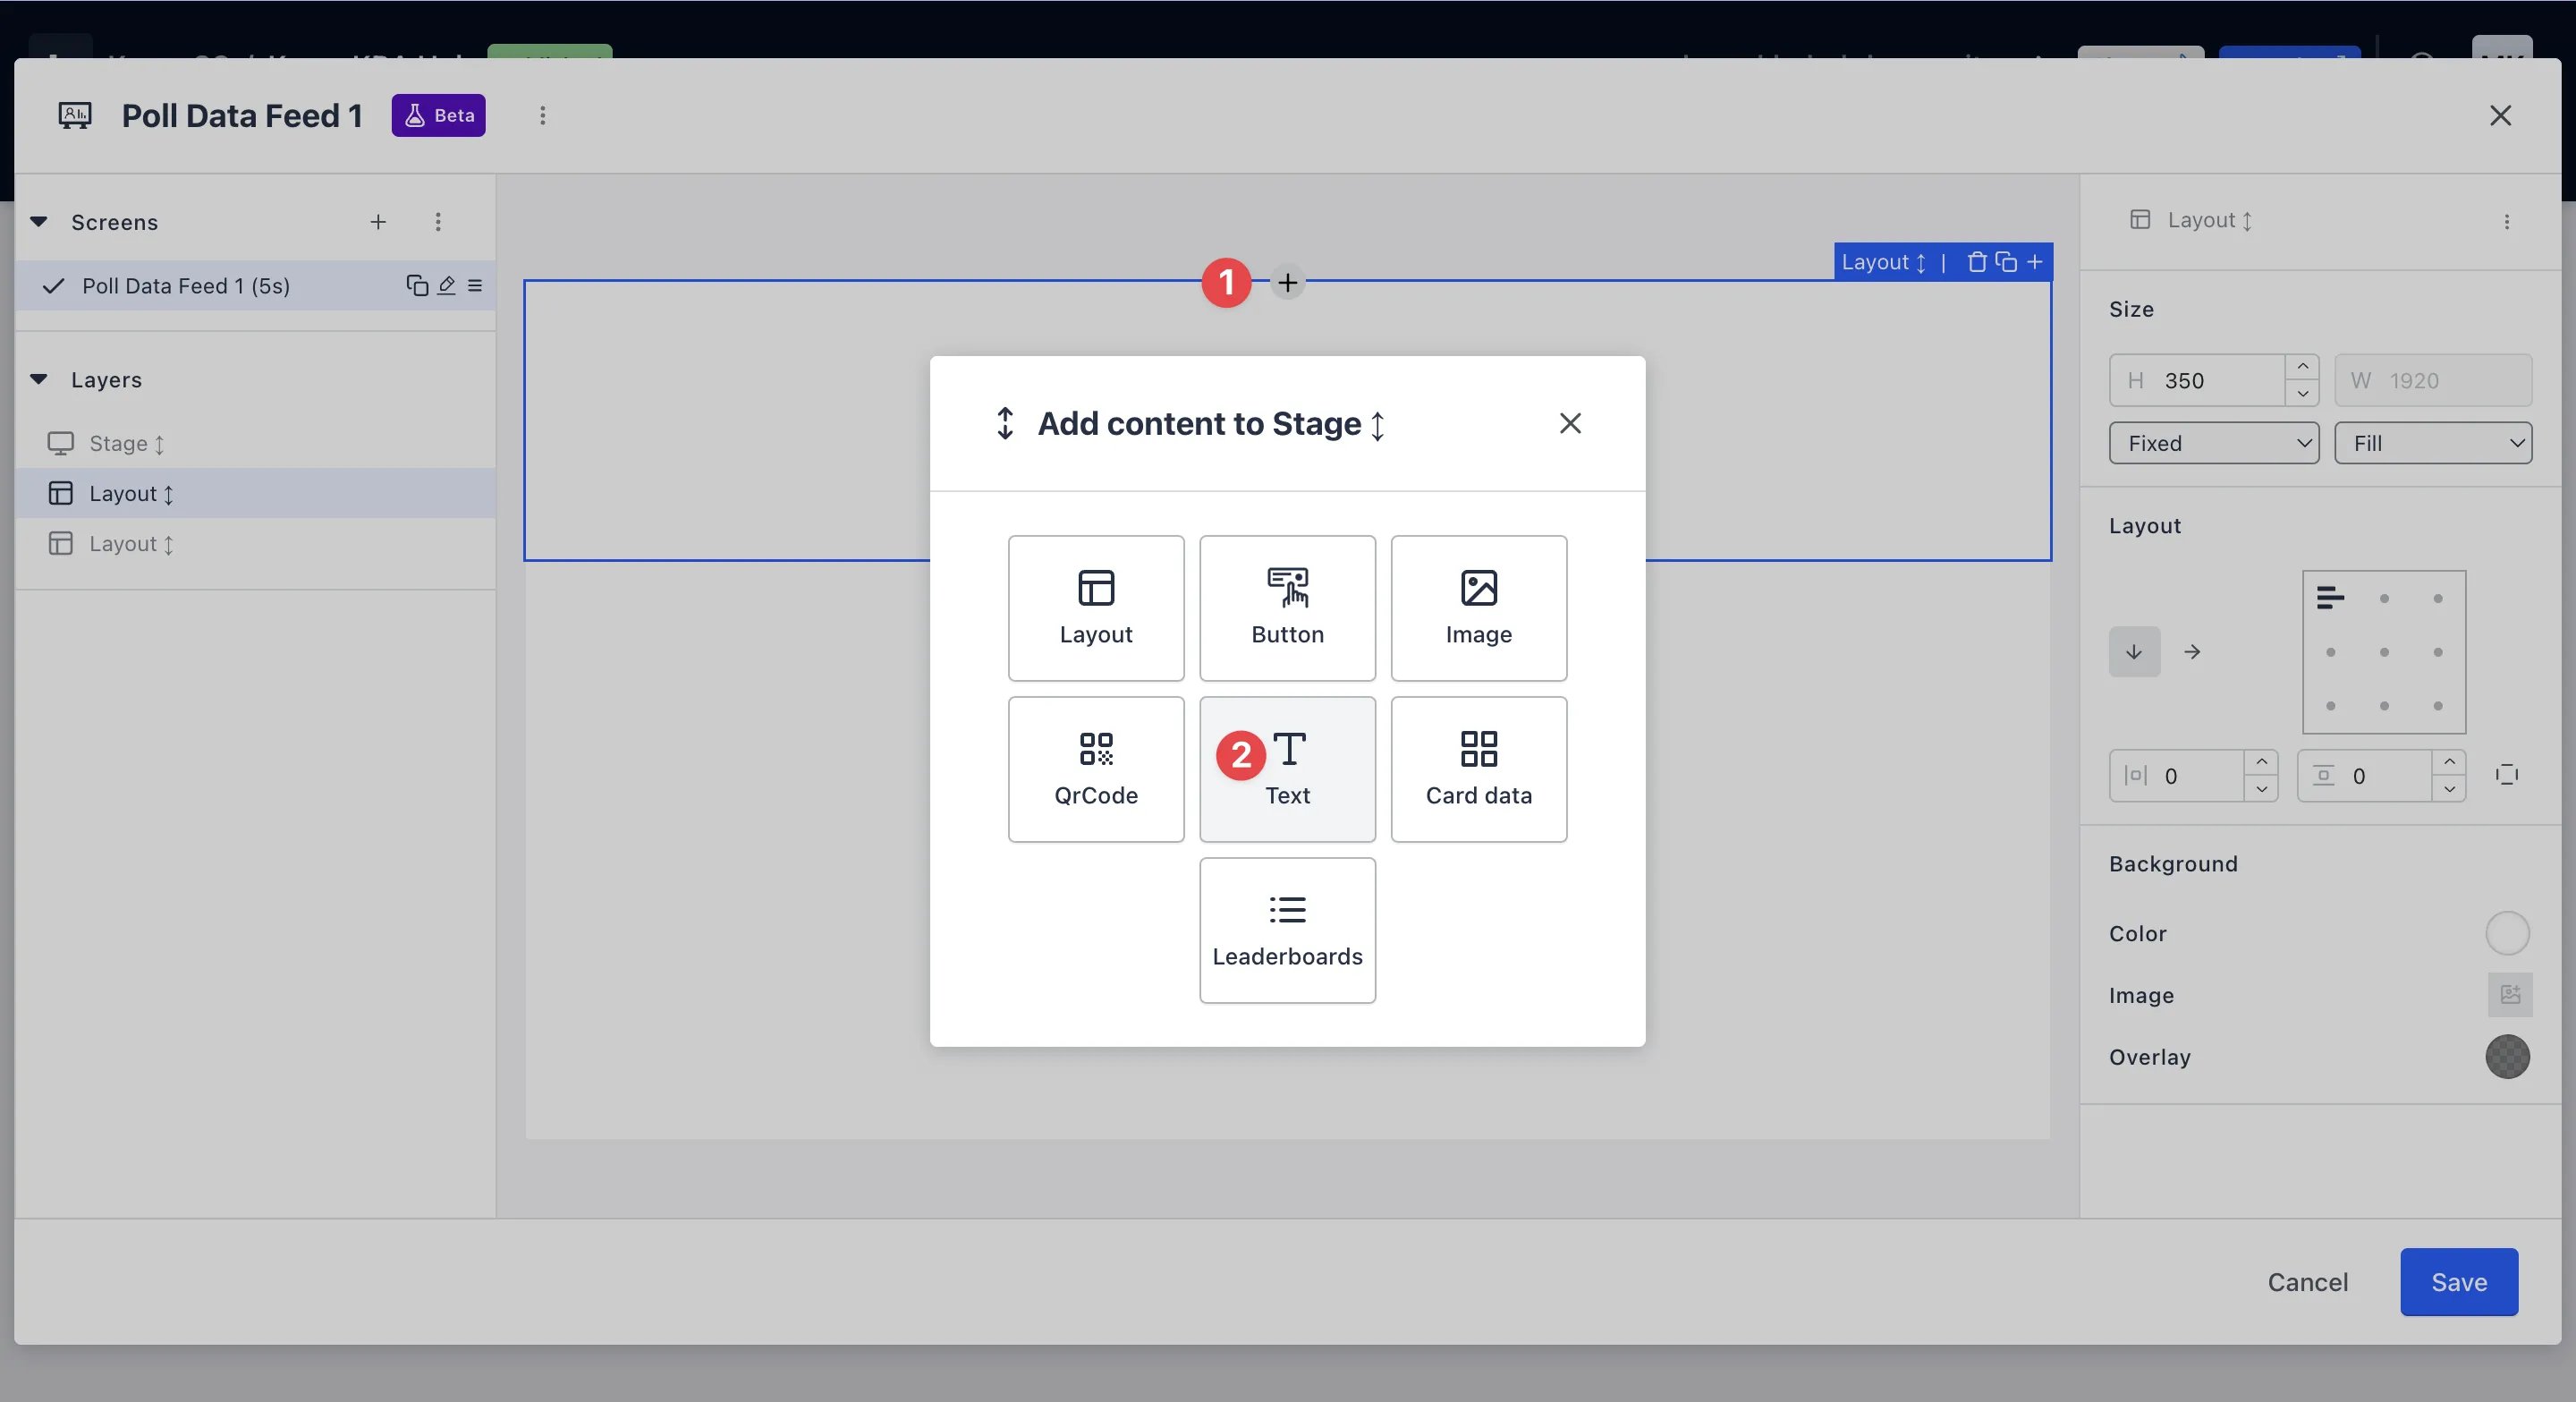
- (1) To add text to your Data Feed, select the section you wish to add the button to and click the + icon that appears.
- (2) Select text from the add content menu.
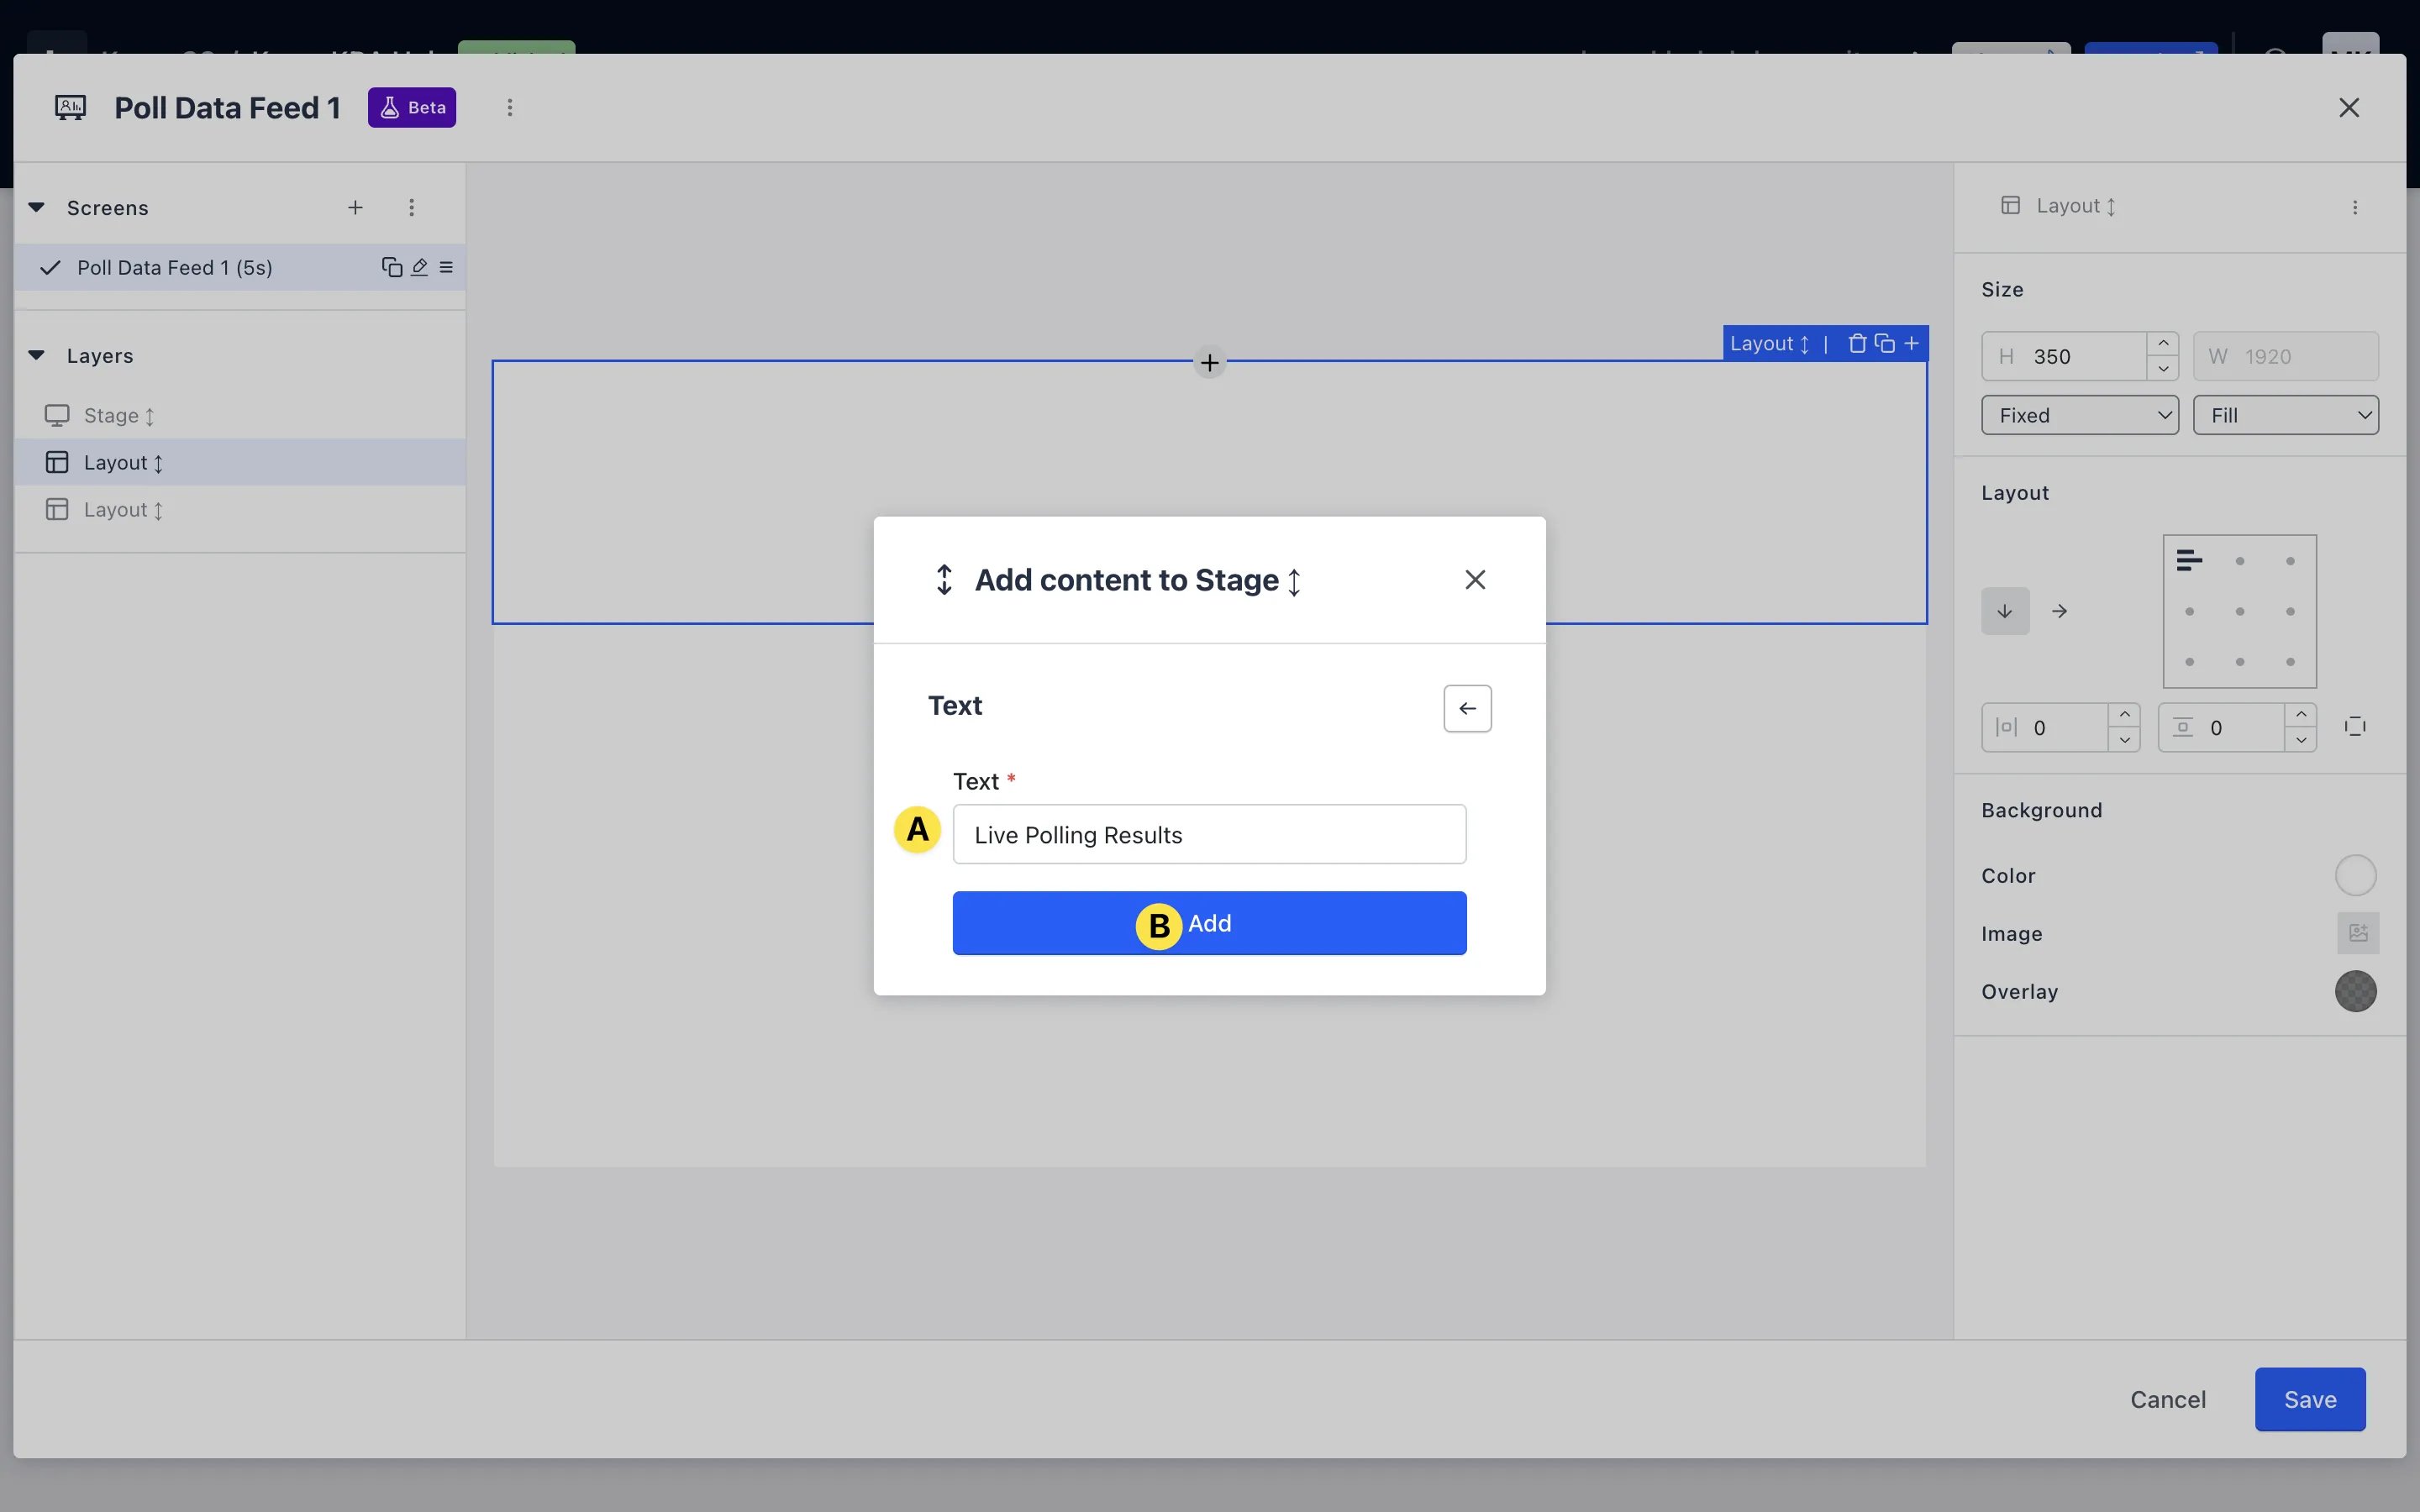
- (A) Input the text you want to display on your Data Feed.
- (B) Click add.
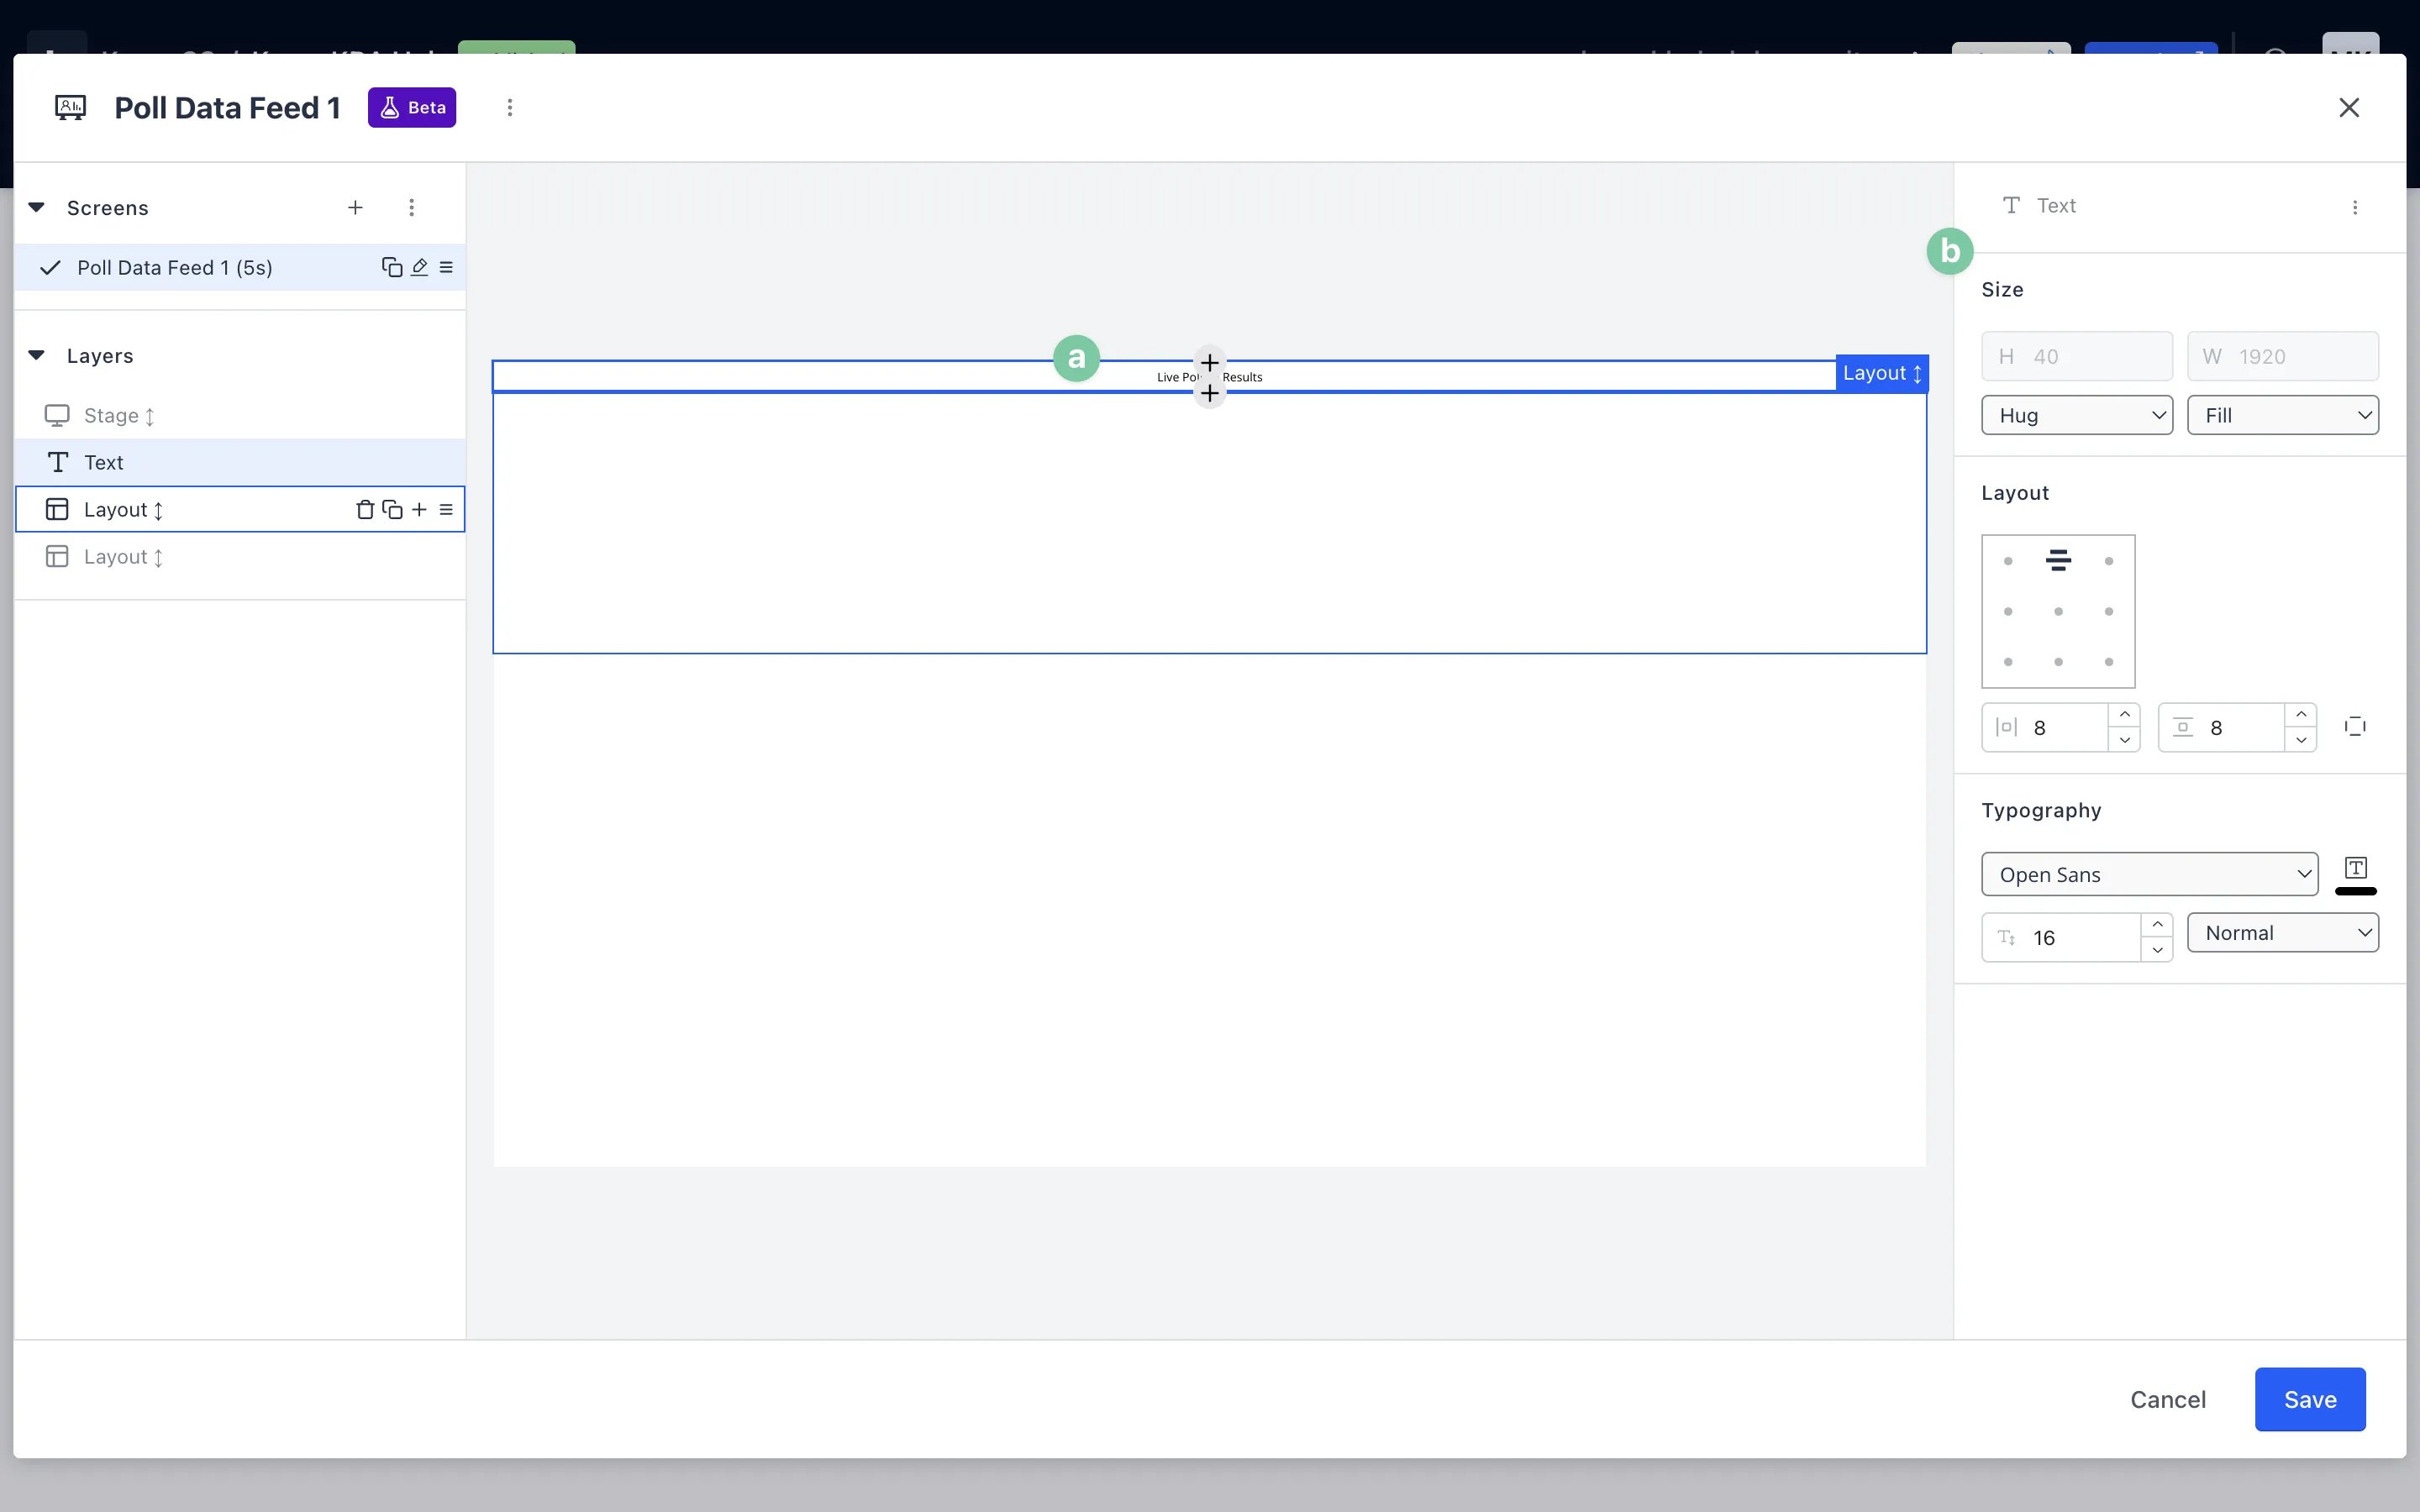
- (a) Once added, you can edit your text by selecting it and navigating to the right-hand settings panel.
- (b) Use the settings panel to adjust the dimensions and styling of your text.
Step 6: Add card data to your Data Feed
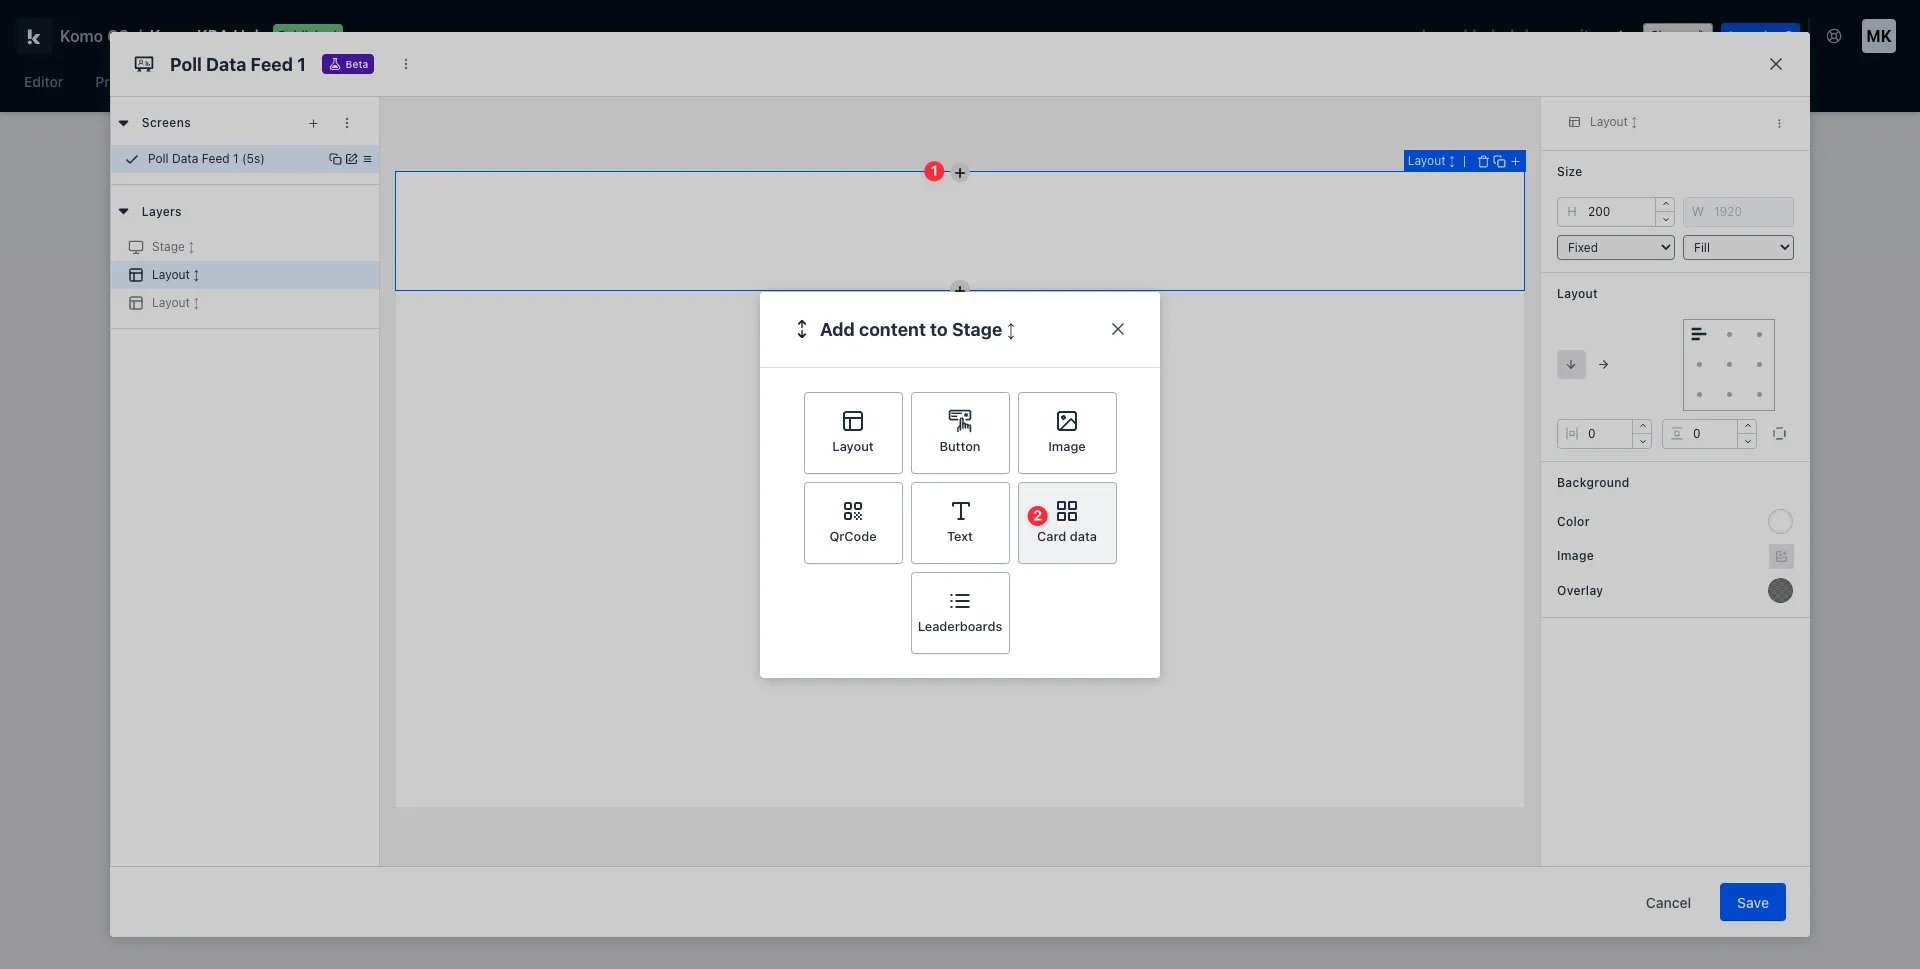
- (1) To add card data to your Data Feed, select the section you wish to add the button to and click the + icon that appears.
- (2) Select card data from the add content menu.
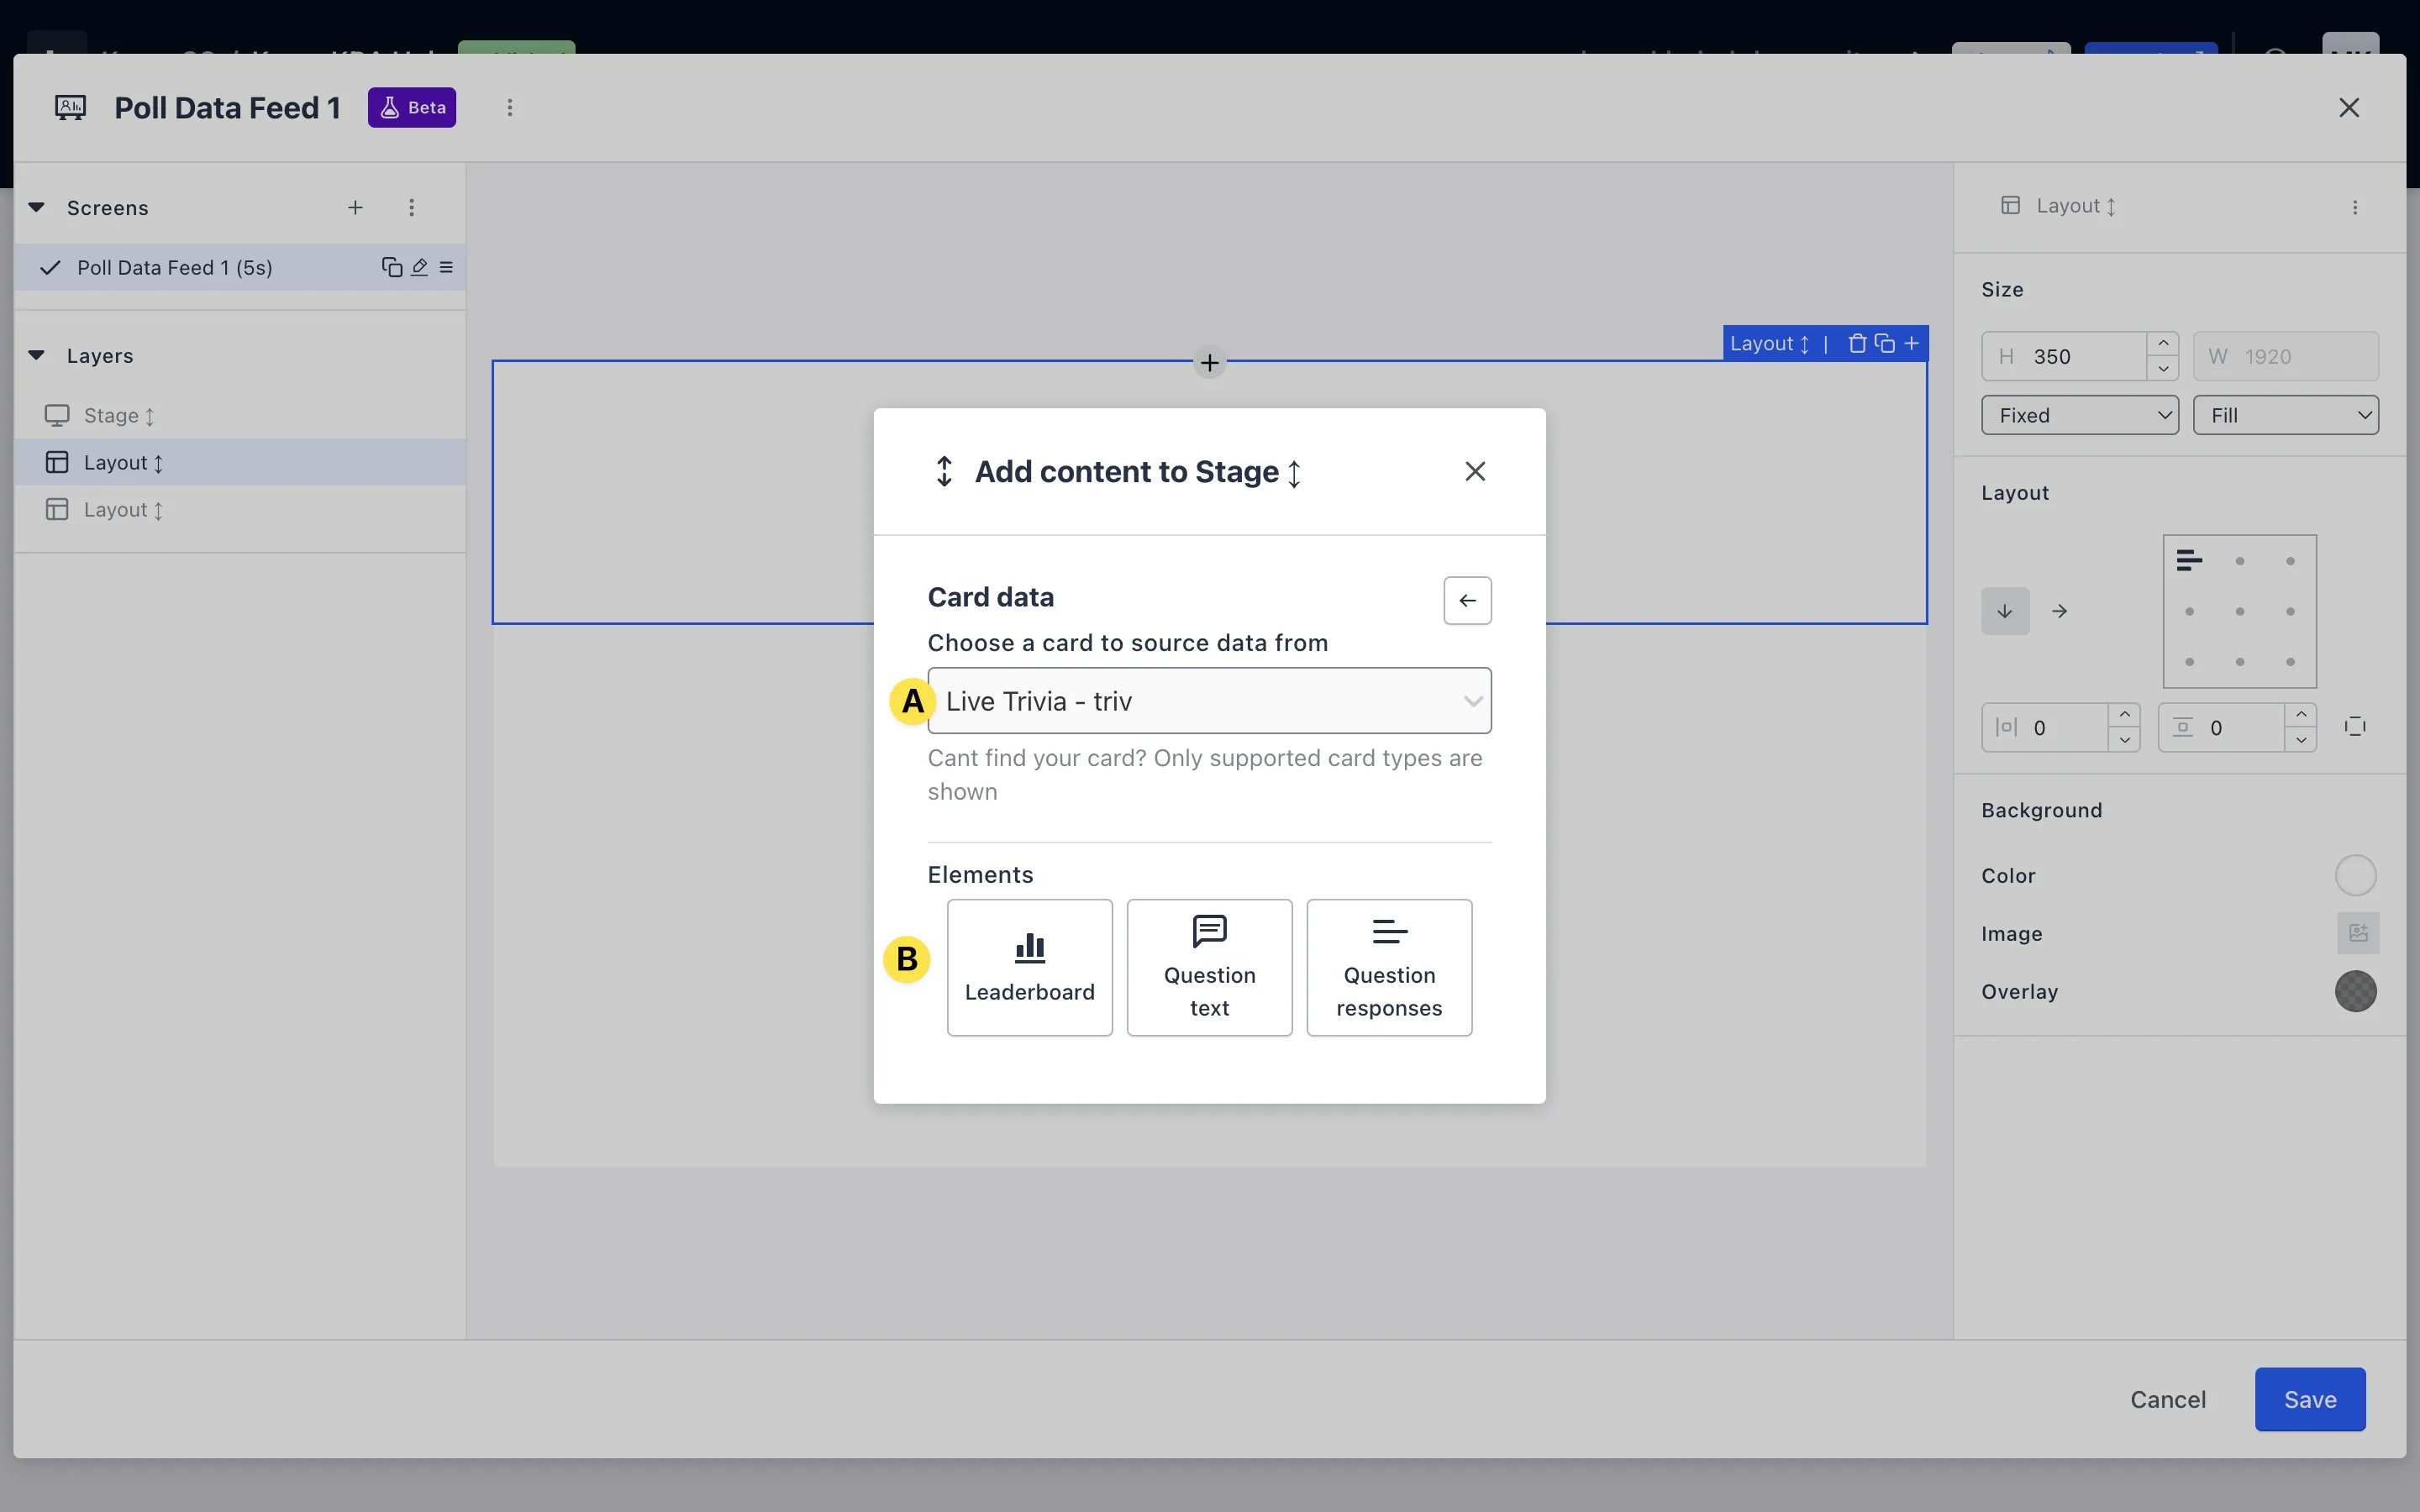
- (A) From the drop-down menu, select the card you would like to source data from.
- (B) Depending on the card you’ve chosen, you will have some data elements to choose from. In this example, we’ve chosen the Trivia card, so we can choose to display a leaderboard, question text or question responses. In this example, let’s choose the leaderboard.
Can’t find your card? Please note that only Data Feed-supported cards are shown.
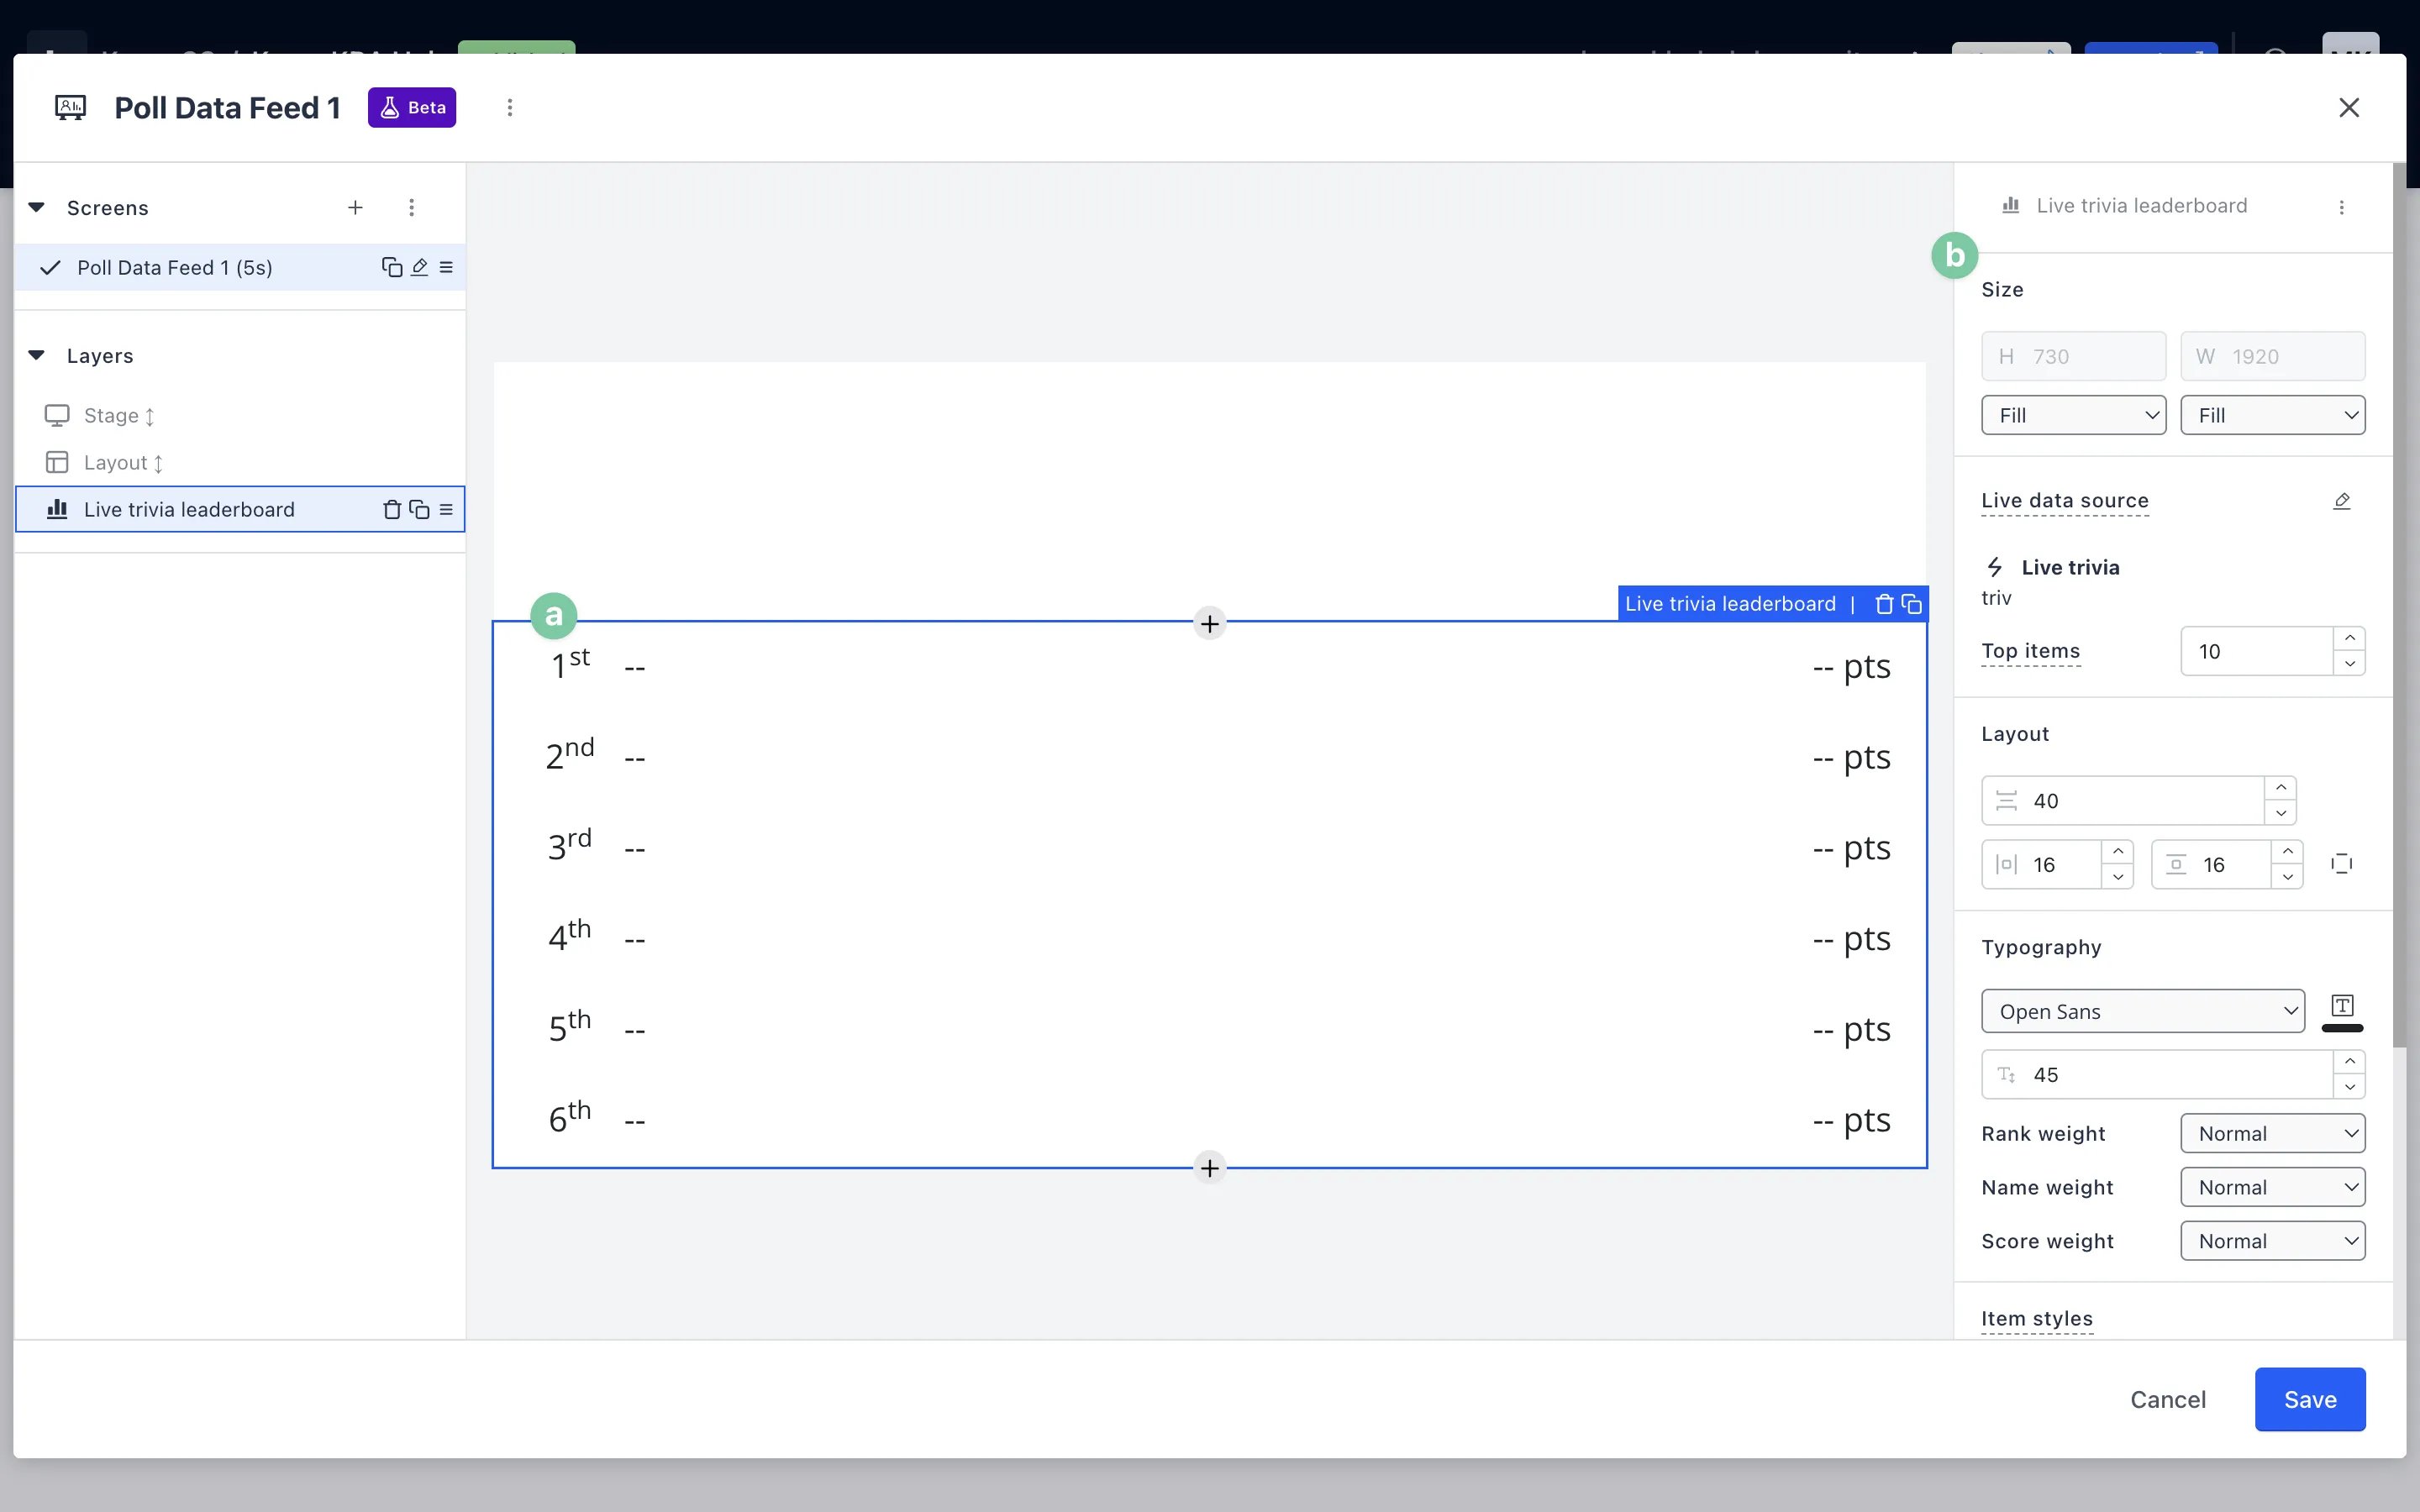
- (a) Once added, you can edit your card data by selecting it and navigating to the right-hand settings panel.
- (b) Use the settings panel to adjust the dimensions and styling of your card data.
Step 7: Style your Data Feed
- Once you’ve added the content you want to display on your Data Feeds, you’re ready to style it.
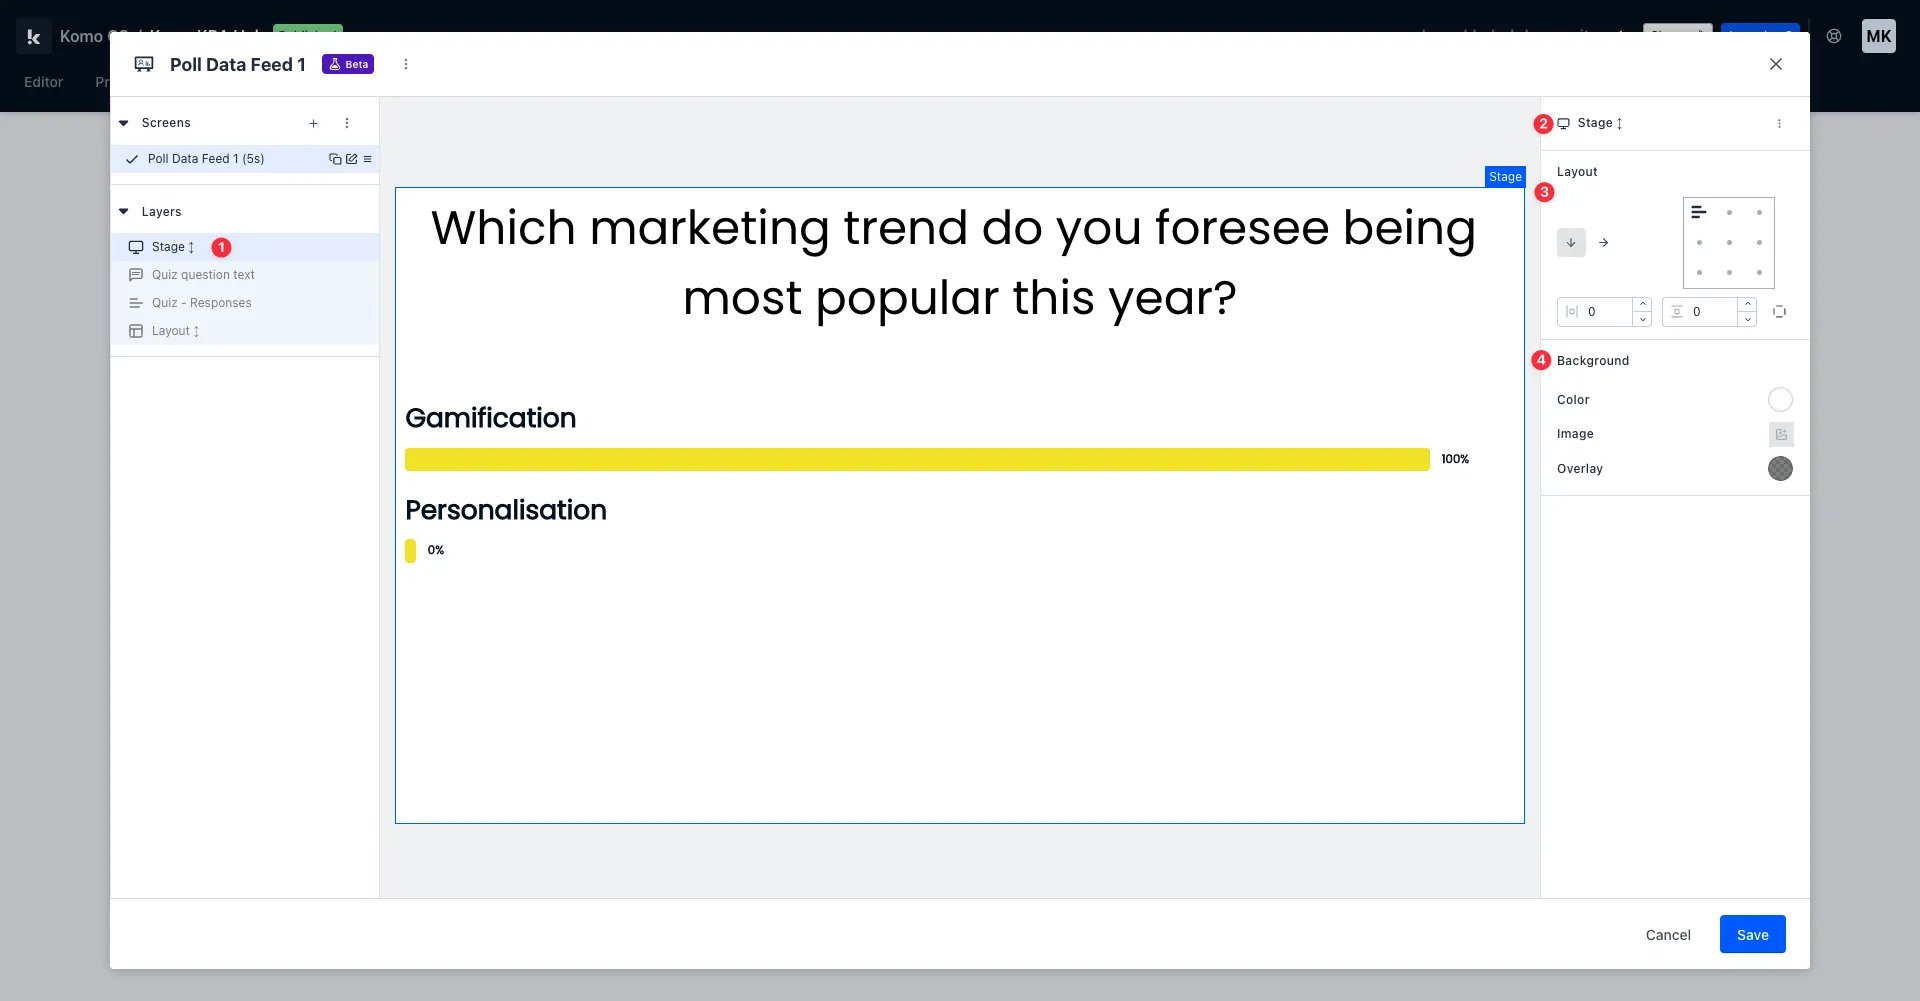
- (1) To begin styling your Data Feed, select your stage.
- (2) Navigate to the settings panel on the right-hand side of the editing modal.
- (3) Here you can adjust your existing layout and the placement of your individual elements.
- (4) This is where you can add a background image, colour or overlay to your Data Feed!
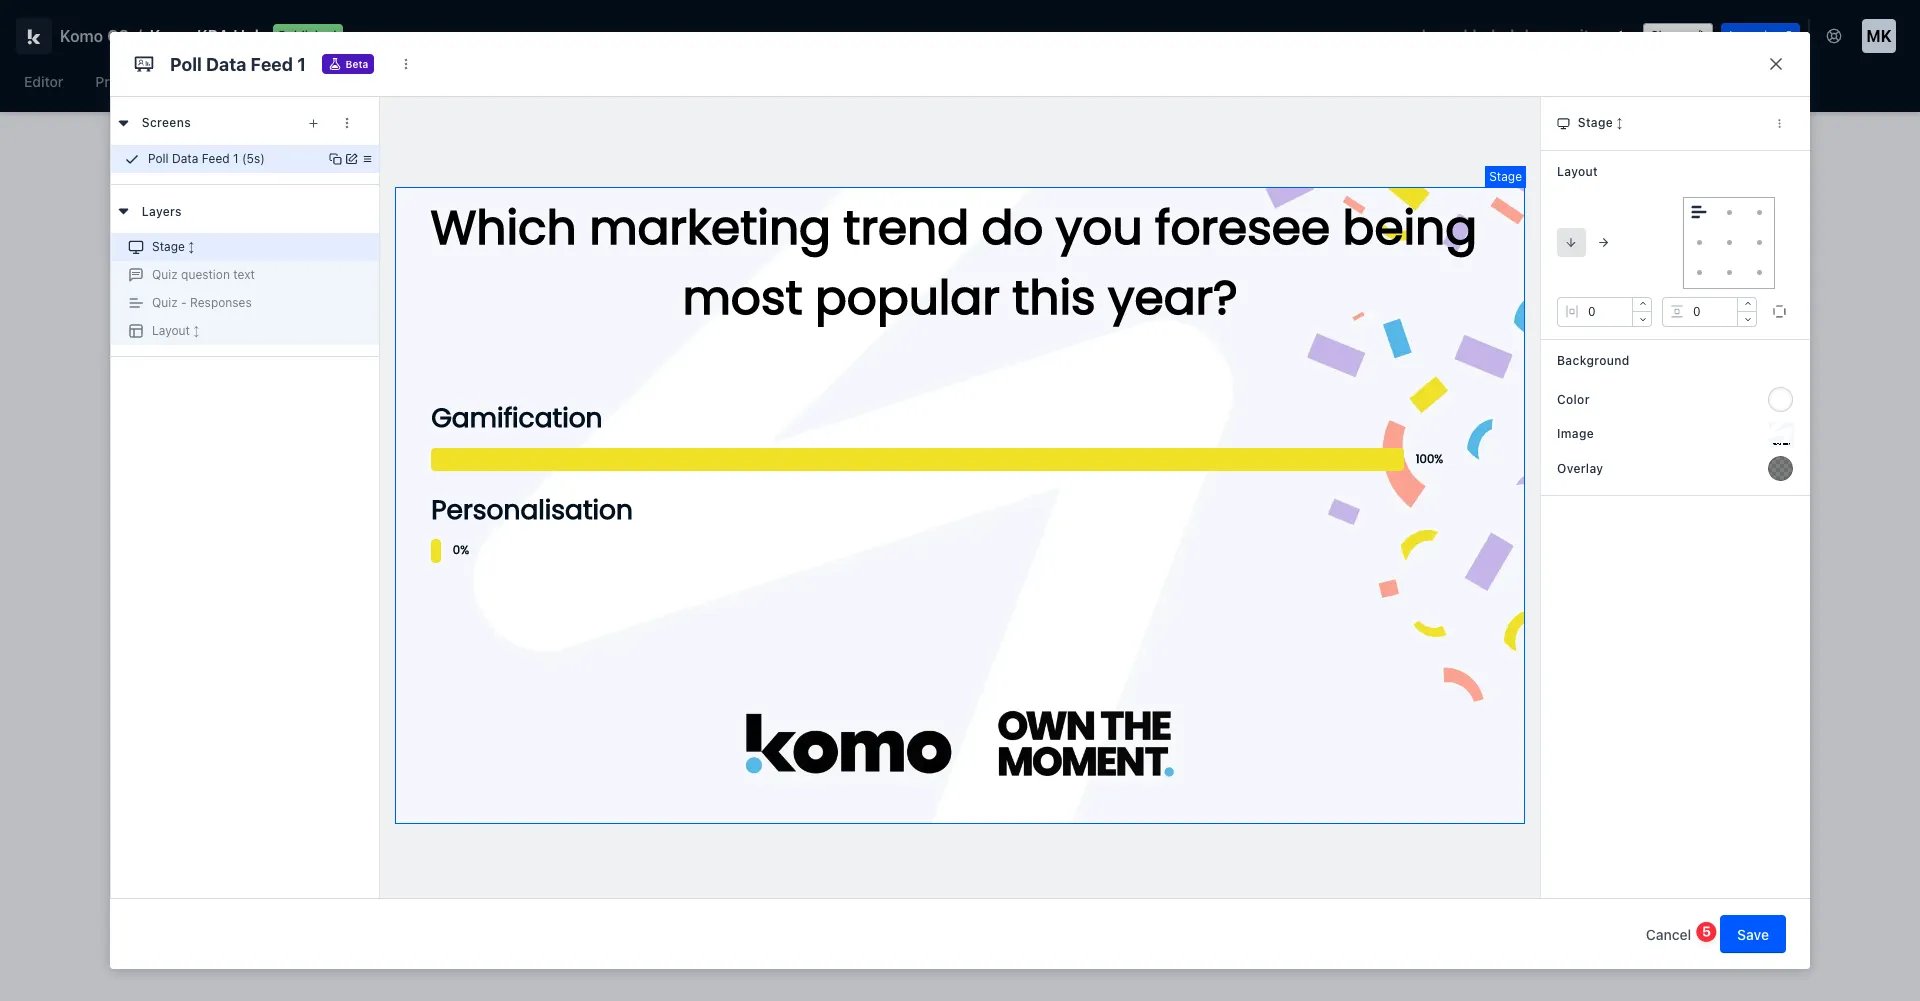
- (5) Once you’ve finished styling, click save.
Step 8: Edit the metadata of your screens
Metadata allows you to edit the name of your screen and the duration [in seconds] of your screen before it automatically cycles through the remainder of your screens.Please note that the duration is only relevant if you have more than one screen in one particular data feed.
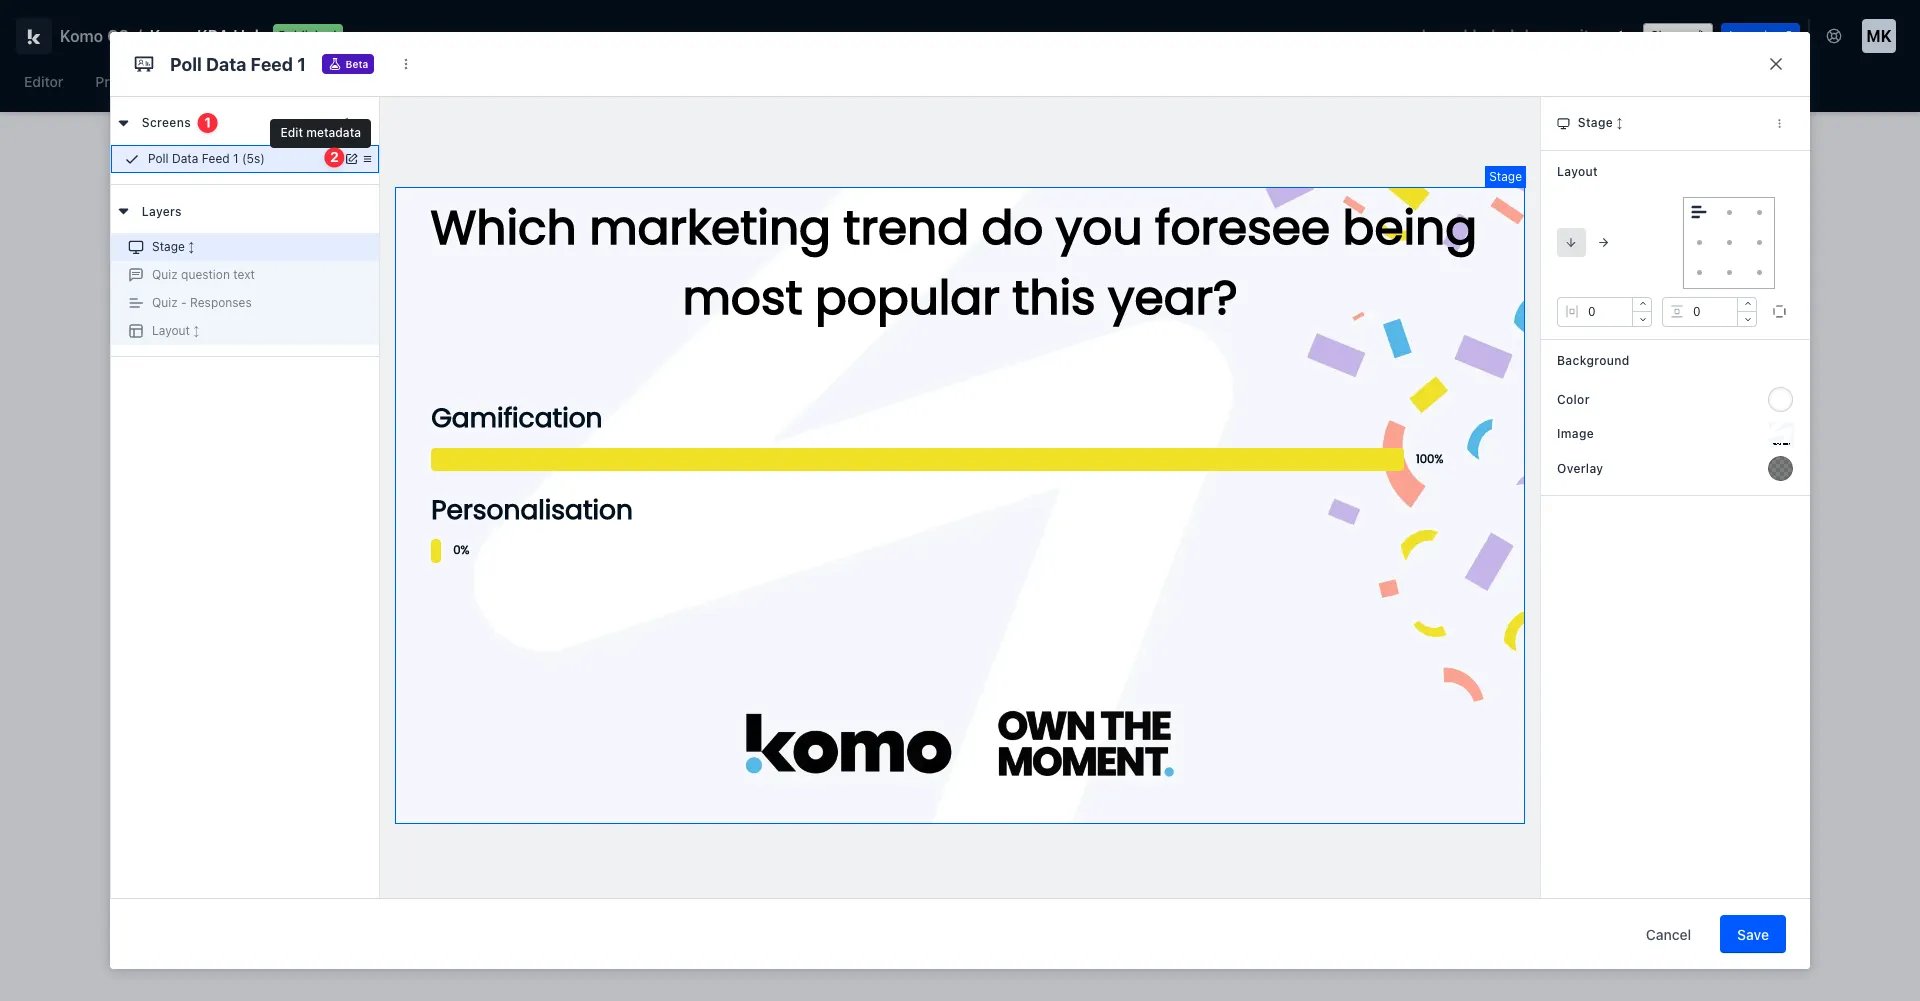
- (1) To edit the metadata of a particular screen, navigate to the screens drop-down menu on the left-hand side of the editing modal.
- (2) Click the edit metadata button.
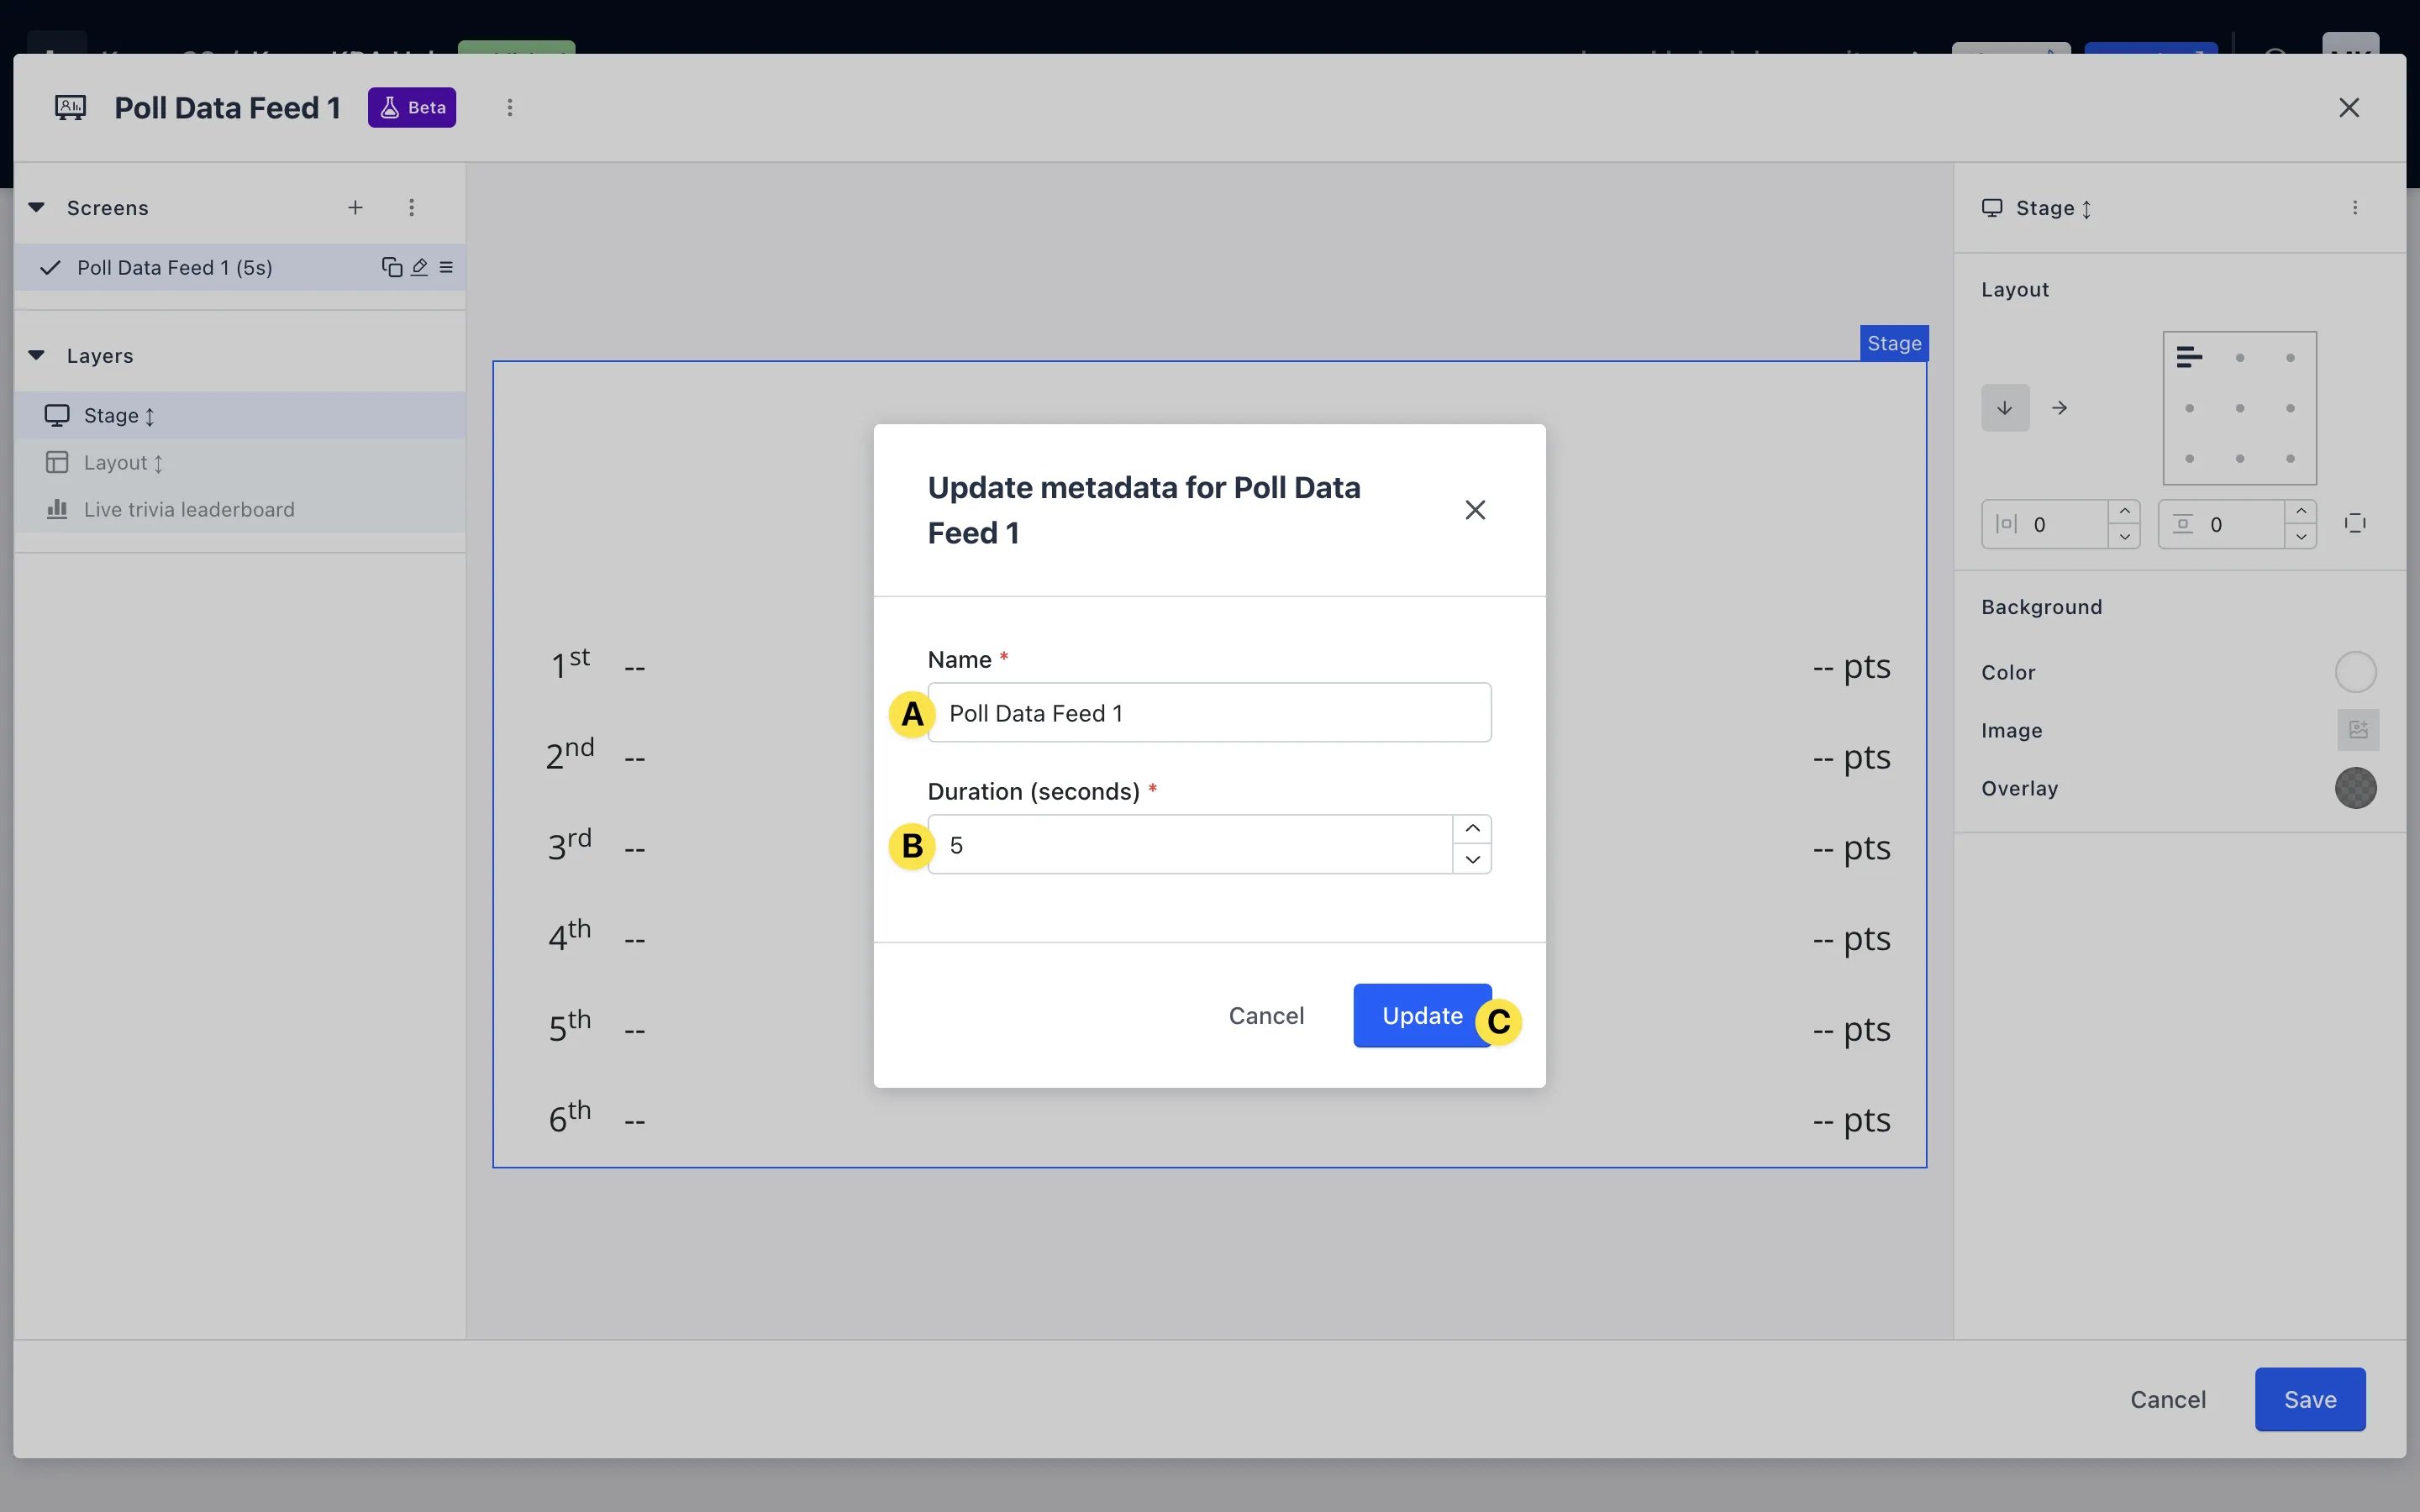
- (A) Here you can change the name of your data feed.
- (B) You can also input the duration of the screen in seconds [see note above for more information].
- (C) Click update.
Sharing your Live Data Feed/s
Step 1: Check your connection to the big screen
- This step will depend on the technology you’re using to share your Live Data Feed but ensure that you have double-checked your connection and tested your Live Data feed prior to your event!
If you’re sharing one [1] Data Feed, go to step 2 & skip step 3. If you’re sharing more than one [2+] Data Feed, skip step 2 & go to step 3.
Step 2: Open your Data Feed
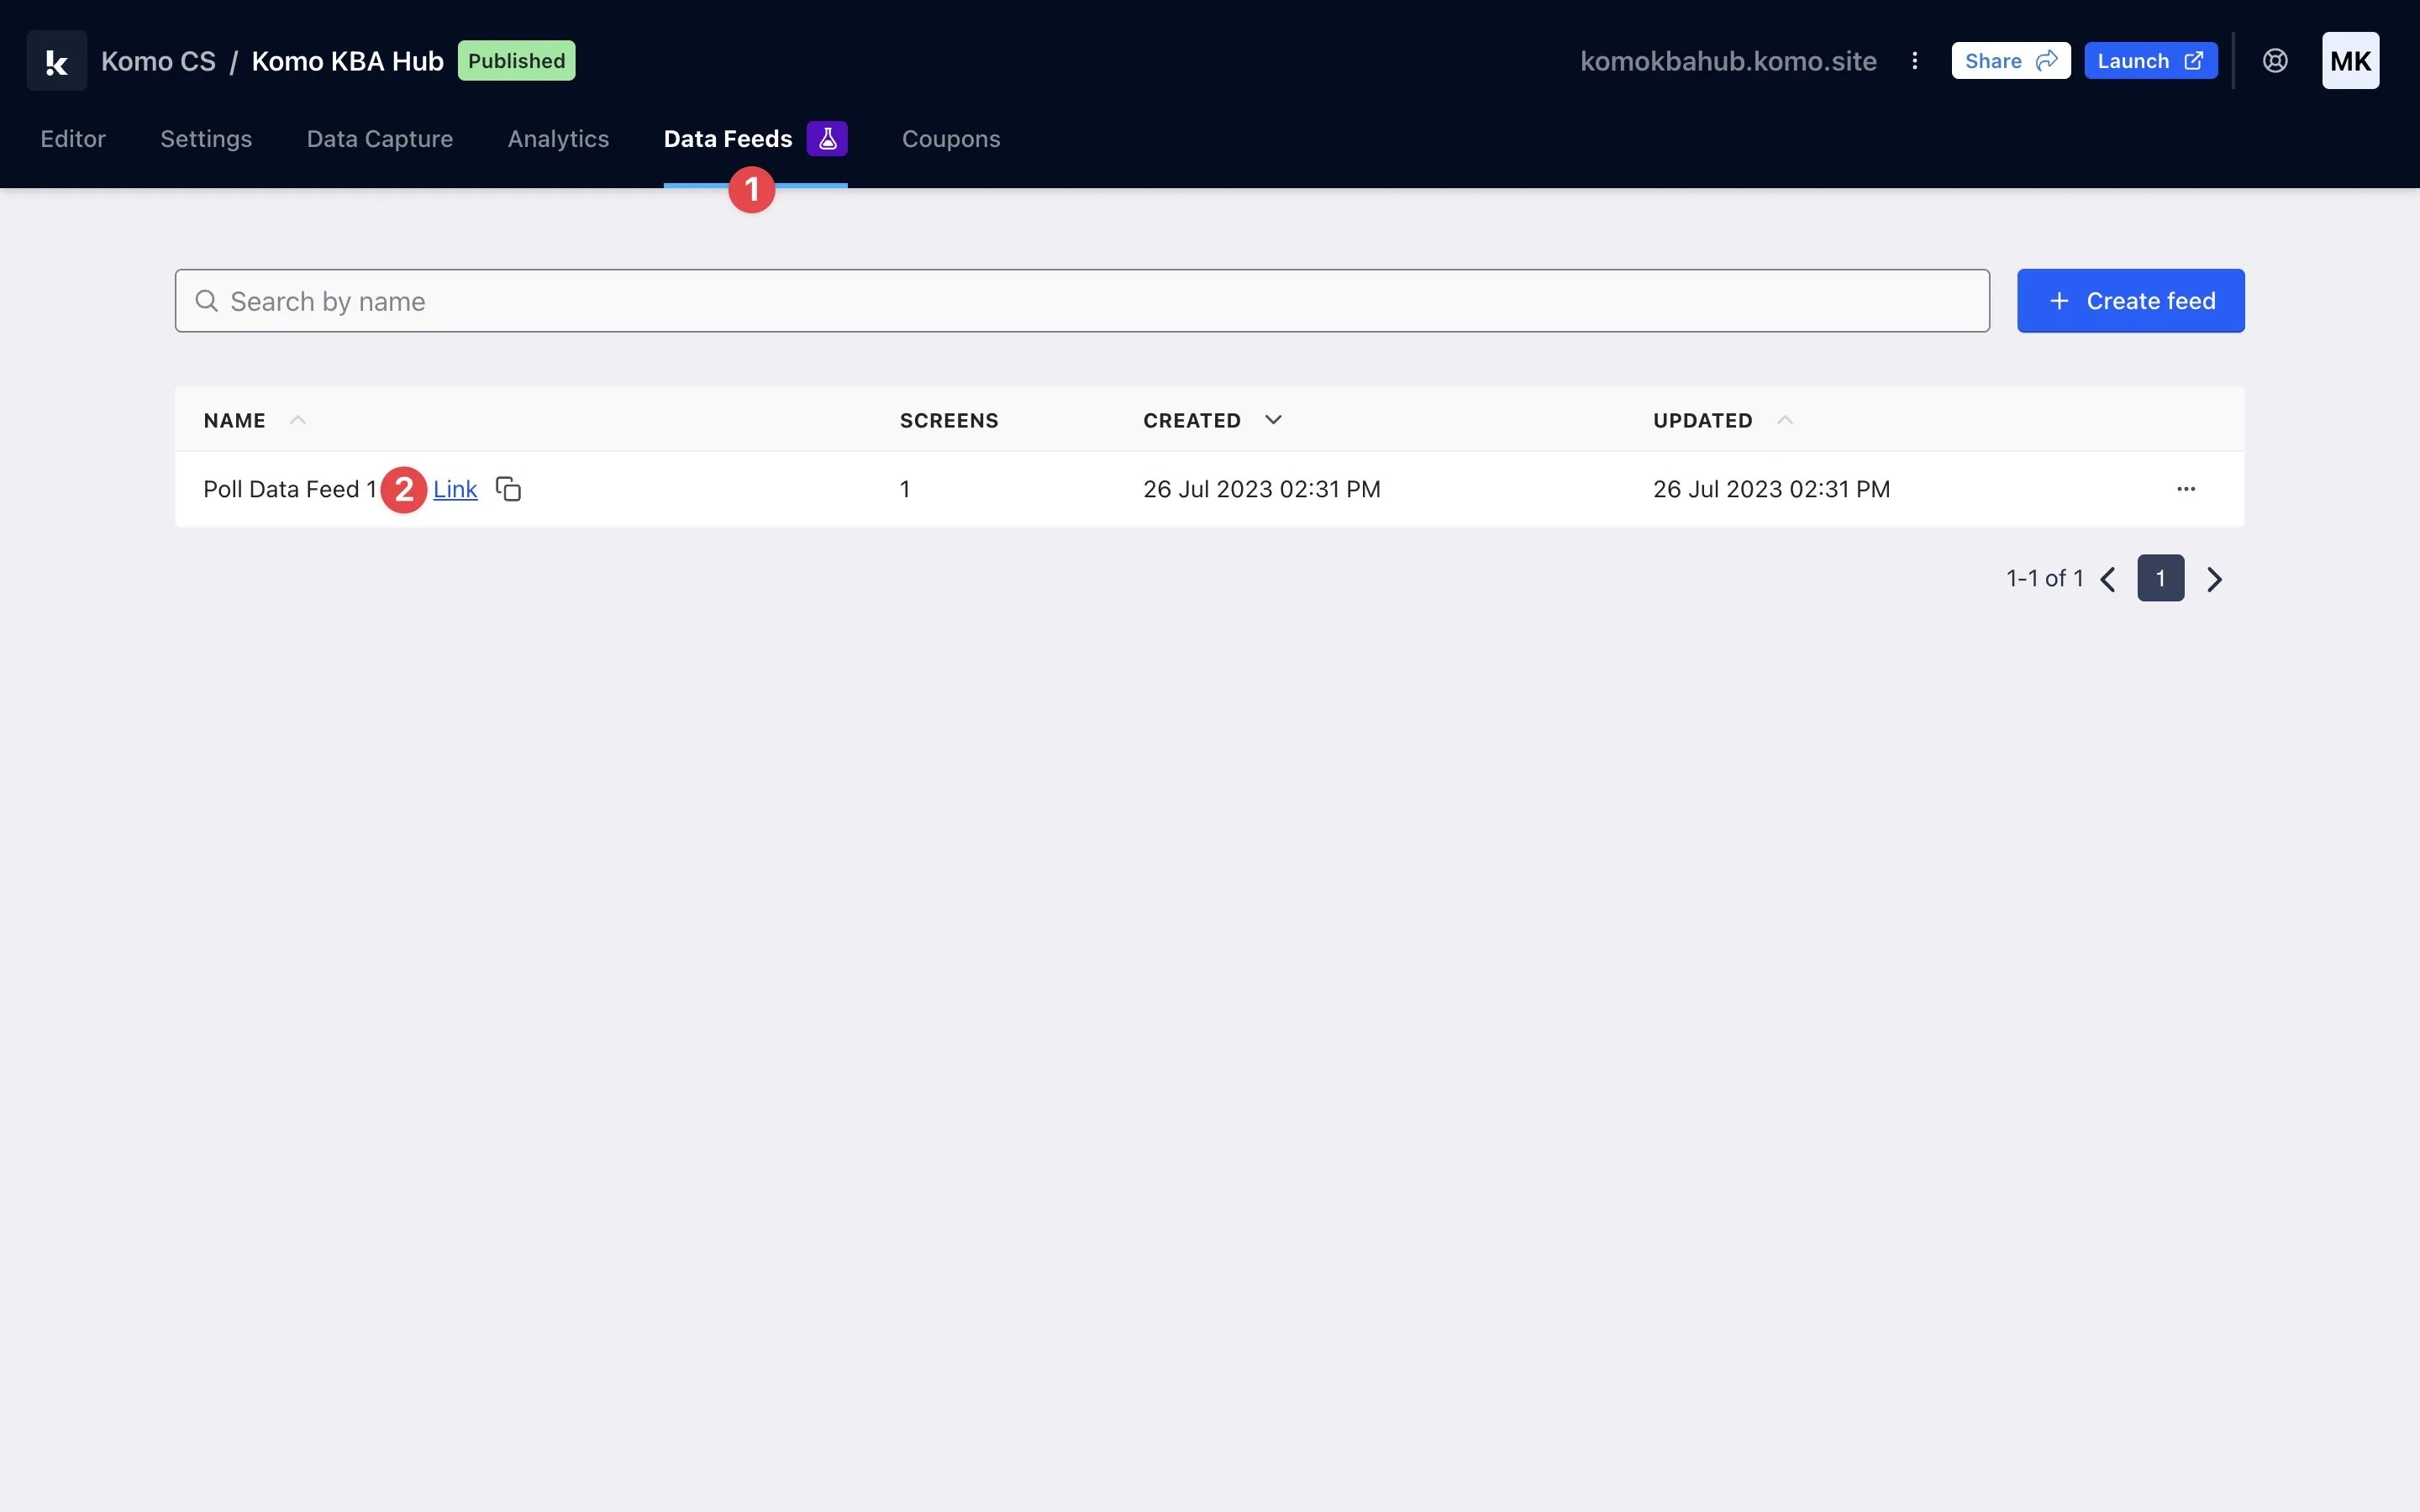
- (1) Navigate to the Data Feeds tab of the portal.
- (2) To open your Data Feed, click on the link button next to the title of your Data Feed, or use the clipboard icon to copy the link to share with your AV teams at your event.
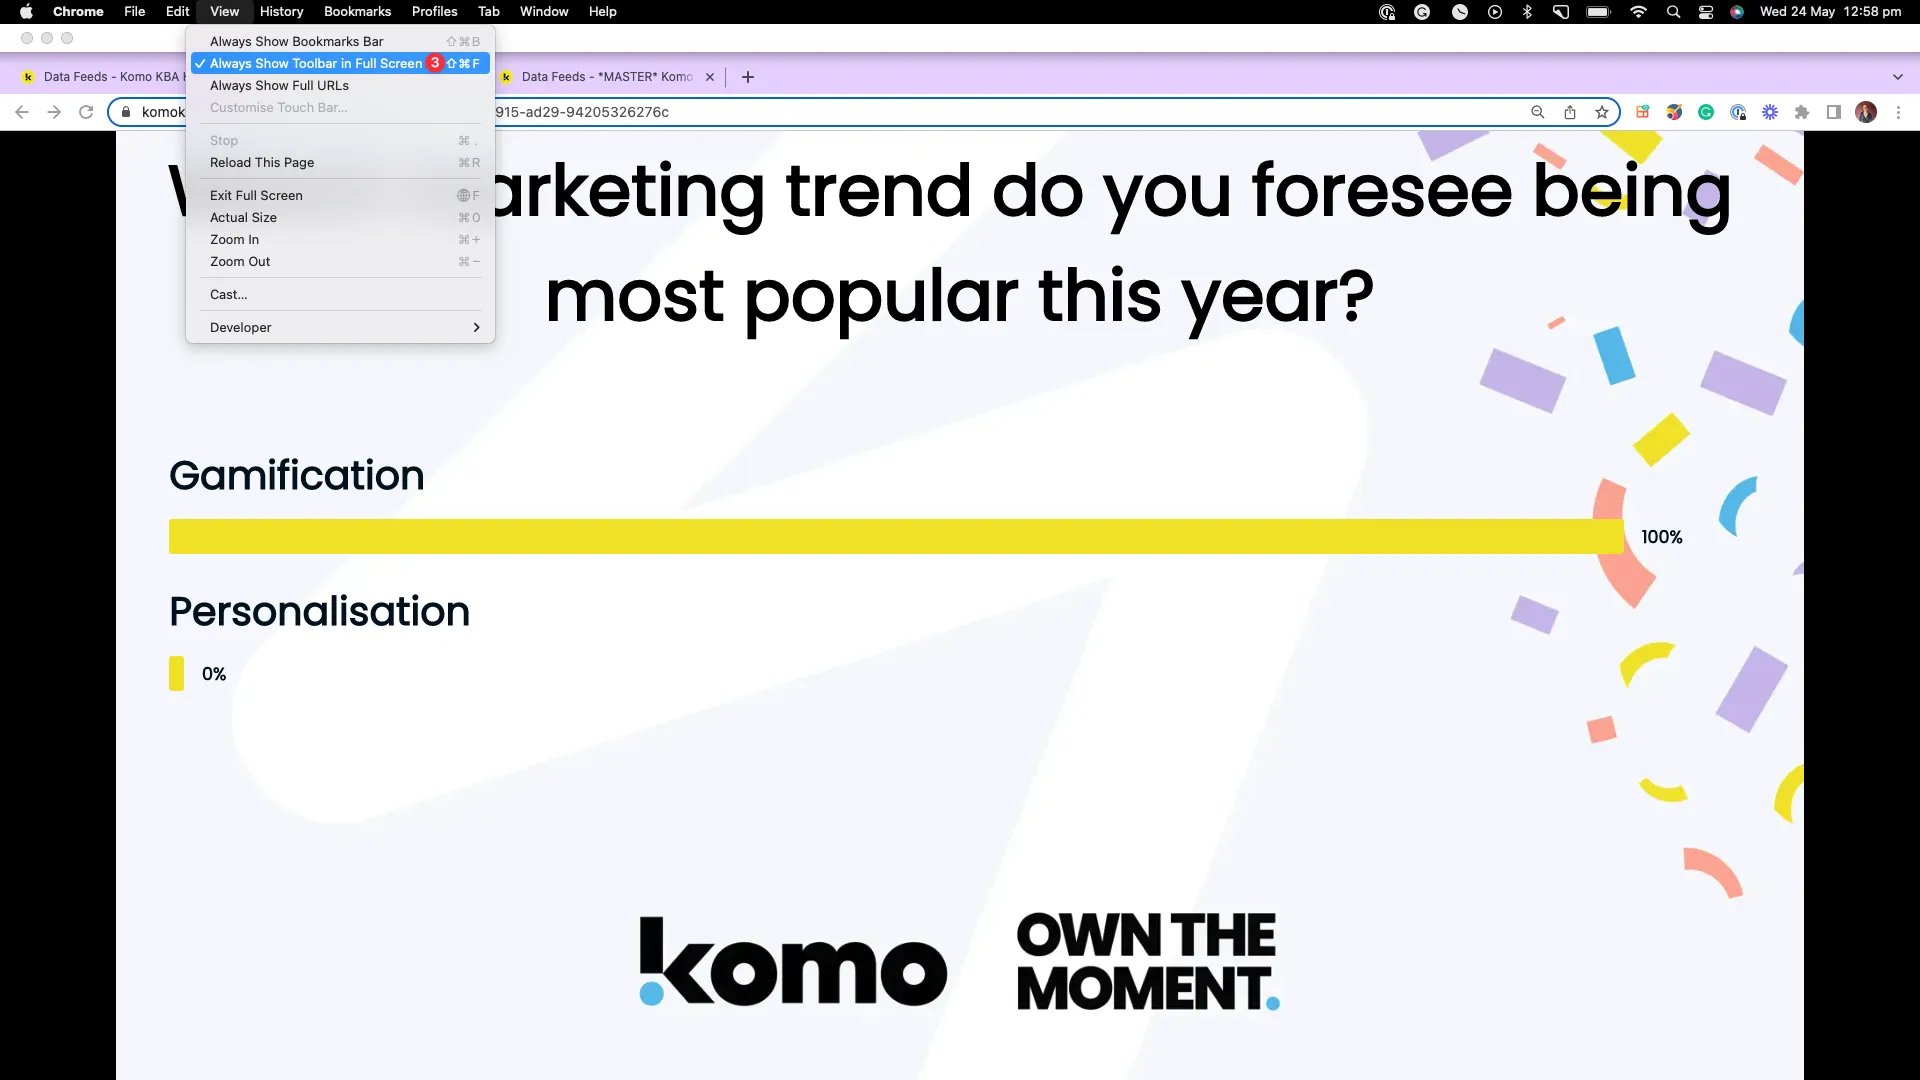
- (3) Your Data Feed will populate in a new tab of your browser. Depending on your browser and/or device, follow the steps to hide your toolbar so that only your Data Feed is visible.
Step 3: Open your Data Feeds & organise your windows
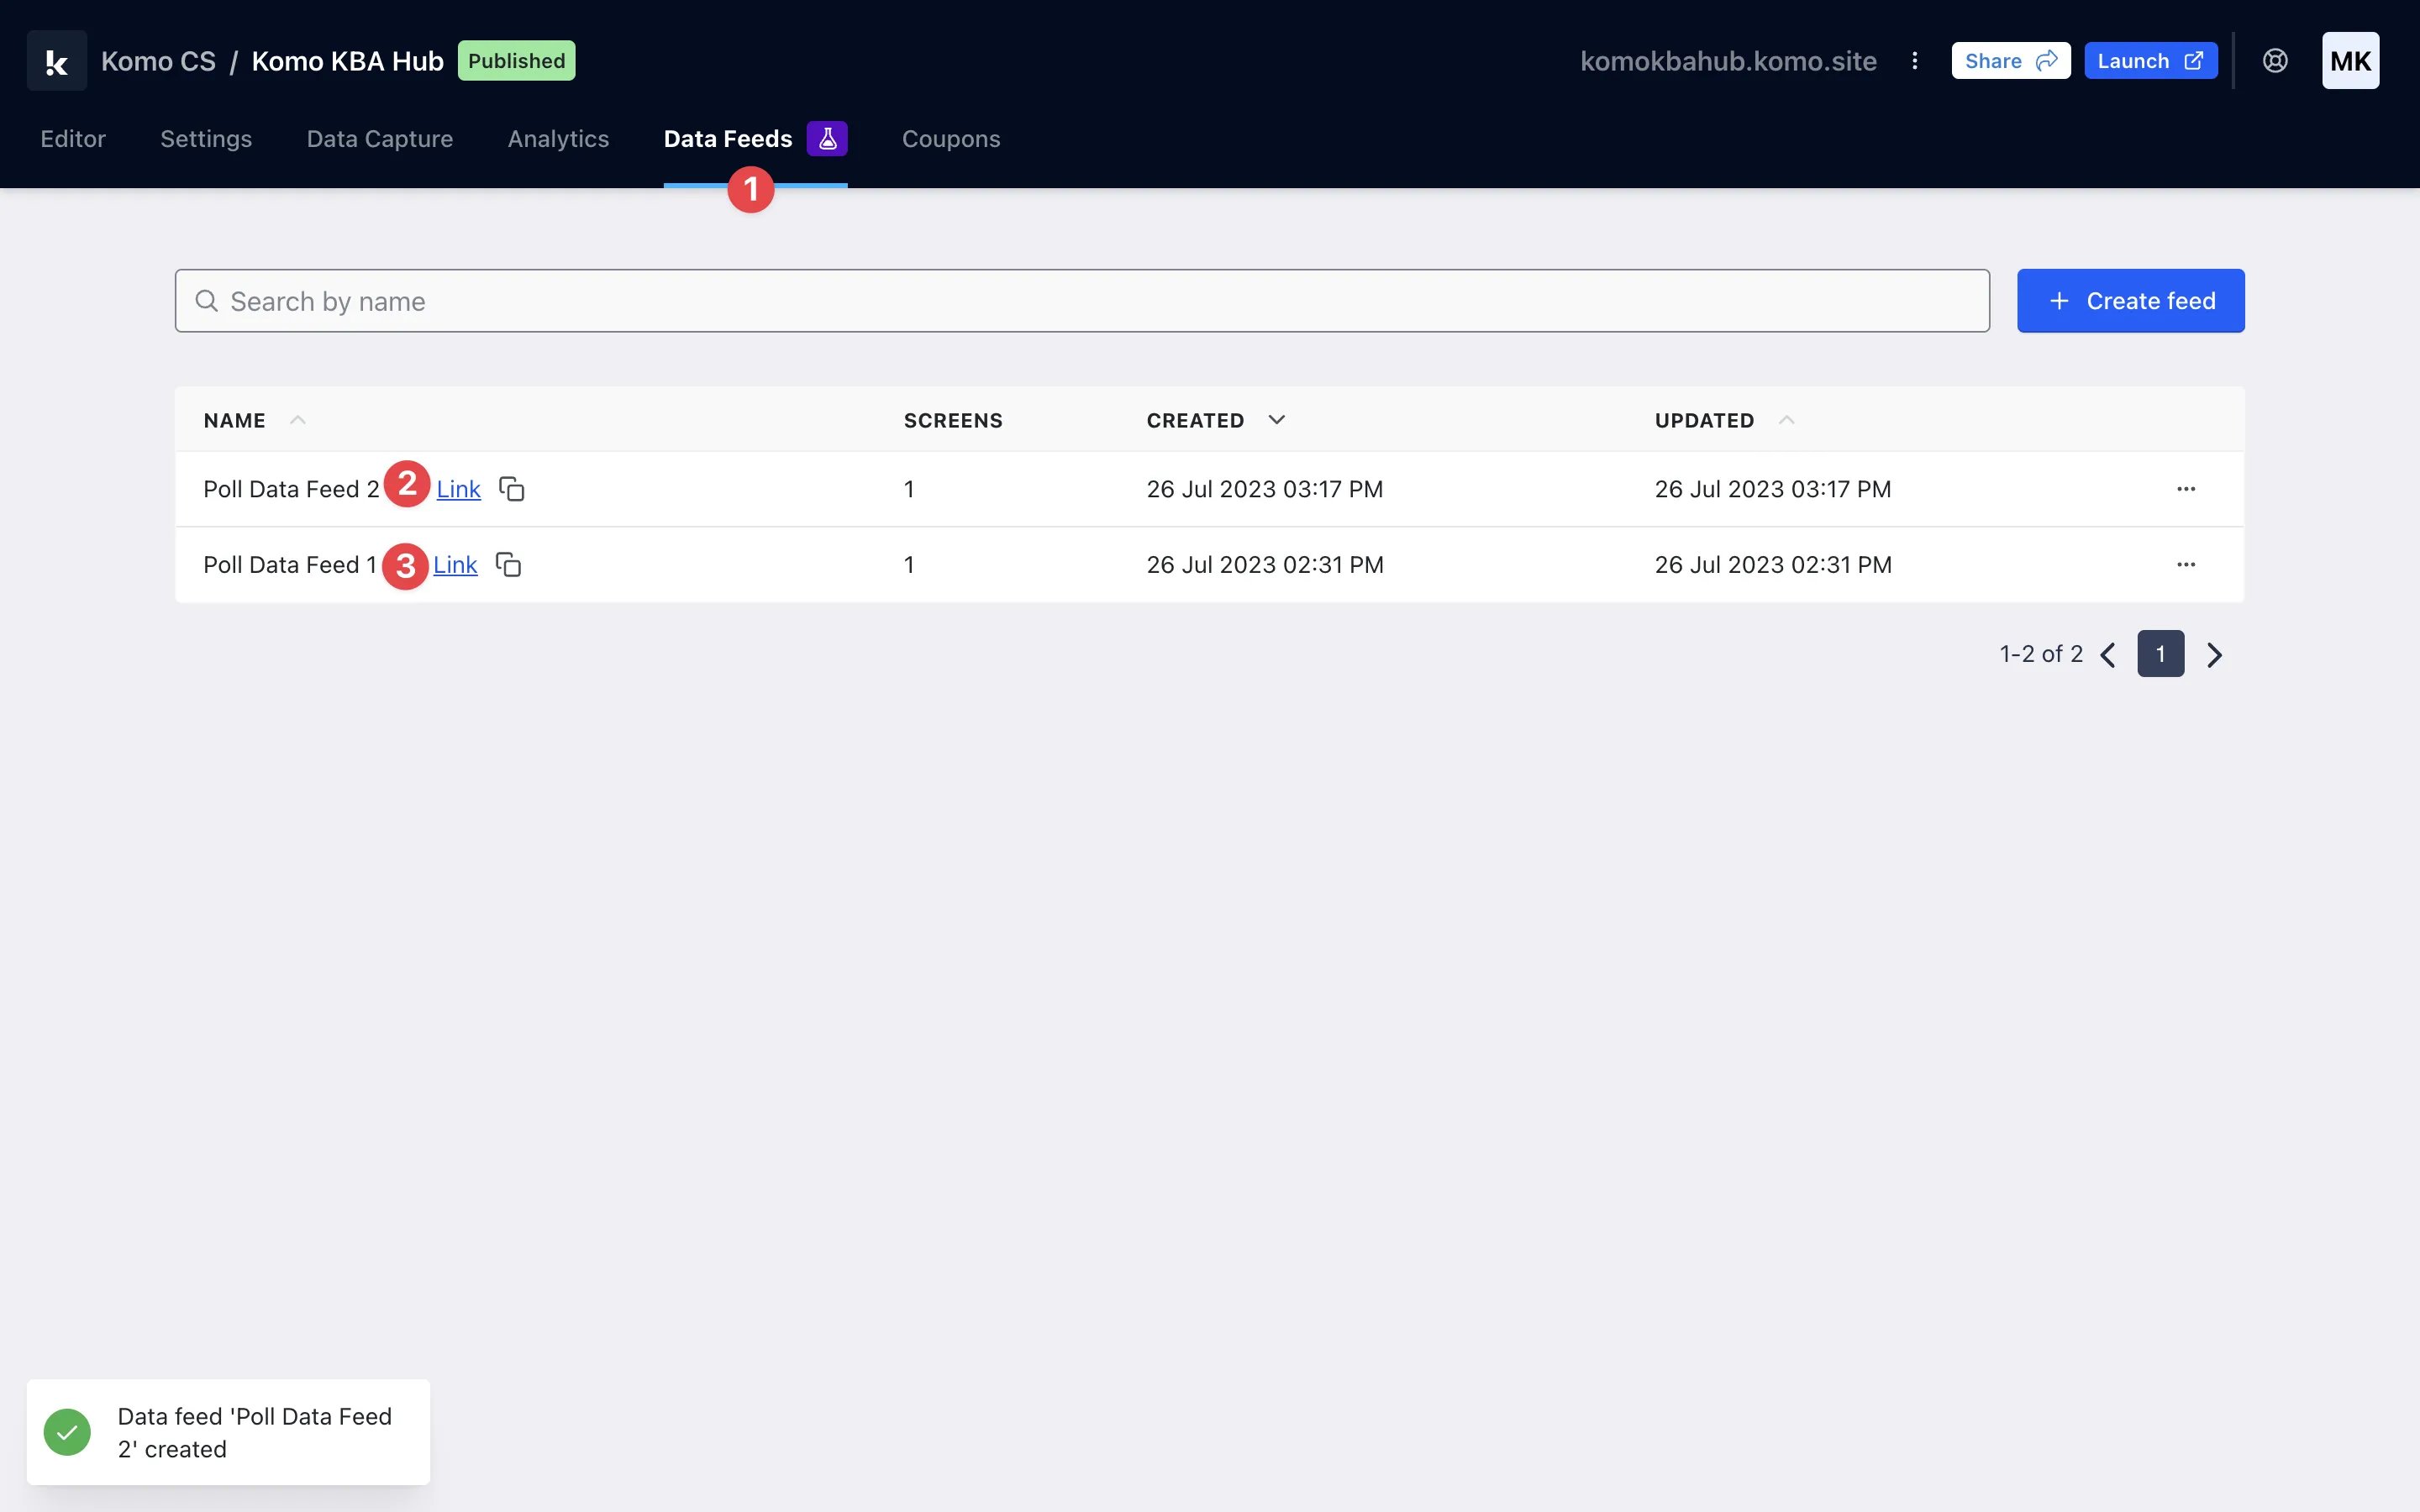
- (1) Navigate to the Data Feeds tab of the portal.
- (2) To open your Data Feeds, click on the link button next to the title of each Data Feed.
- (3) Your Data Feeds will populate in multiple new tabs of your browser. Because you’re using separate data feeds, we recommend moving these tabs into separate windows so you can easily switch between them.
- (4) Depending on your browser and/or device, follow the steps to hide your toolbar so that only your Data Feeds are visible.
- (5) Ensure that you organise your Data Feed windows so that they are in the order you desire to display them and that you don’t have any external windows open when you’re ready to display them - this will ensure a seamless live experience.
”Go Live” Checklist
Ready to go live with your Data Feeds? We recommend reviewing the following list before launching and double-checking that you have:- Tested your Live Data Feed by opening it up.
- Ensured all dimensions within your screens are correct.
- Ensured all styling of your screens reflects your brand.
- Made any connected cards live to ensure they will pull data in real time.
- Organised your windows if you are displaying more than one Data Feed.
- Set up your window so that your browser toolbar isn’t visible.
FAQ
Will card data and leaderboards update automatically when they’re displayed? Yes! If your audience is playing a game live, the Data Feeds will pull response data in real time. This is also true of leaderboards, which will populate with first-party data and scores as the action happens. Can I upload my own QR code to a Data Feed instead of using the in-built feature? You absolutely can! Create your QR code using your external source and upload it as an image (follow step 4 in preparing your Data Feed).Top tips
- A great place to start when creating a Data Feed is to choose a layout, like in step 2 of the ‘preparing your data feed’ section of this article. This will allow you to add different content to separate sections of the screen, such as a section for your logo, your title and your card data.
- Include some context on your screens so that audience members know what they’re looking at! For example, if you are displaying a leaderboard, include a title like ‘Live Trivia Leaderboard’.
- Include promotion screens as a part of your Feed to direct audience members back to your Hub using a QR code.
- We mentioned this earlier, but in case you missed it, uploading a background image to your Data Feed is a great way to ensure that your logo and other brand assets are reflected without having to upload them as separate elements like images!